Markets
The Largest Export of Every U.S. State in 2017
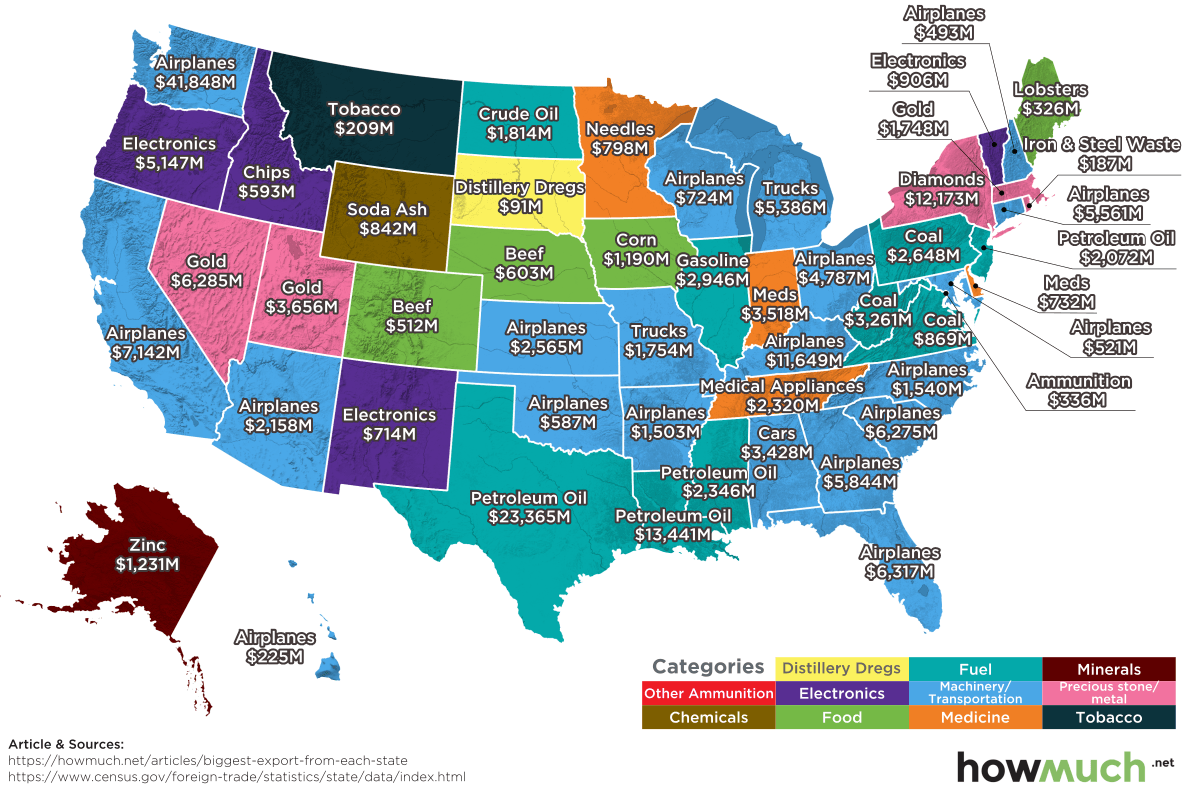
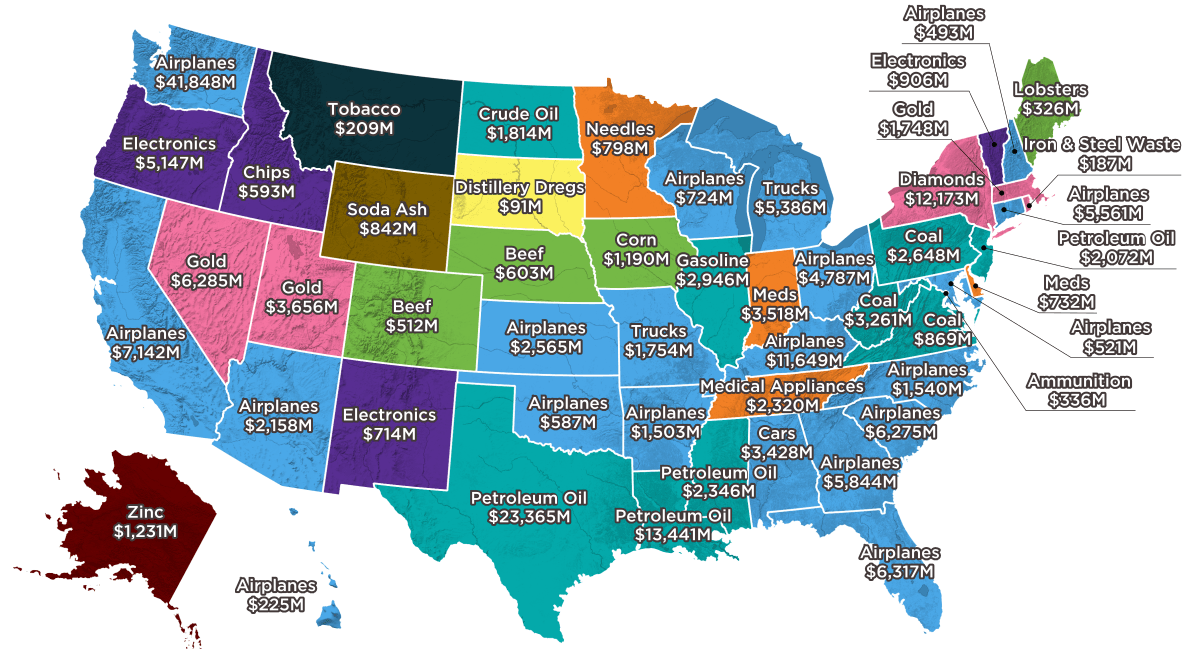
The Largest Export of Every U.S. State in 2017
Last year, the U.S. exported $2.3 trillion worth of goods to international customers.
The country’s main exports are exactly what one would expect, with categories like aircraft, refined petroleum, vehicles, vehicle parts, and computer chips constituting the biggest chunk of overall goods.
However, today’s infographic from HowMuch.net zooms down to the state level, where things get much more interesting. Some states tow the line by exporting one of the major U.S. goods, while others specialize in categories that you probably couldn’t ever guess.
Towing the Line
We’ll start by looking at dollar values for the states that have the single largest exports.
Here are the top 10 states:
| Rank | State | Type of Good | 2017 Value |
|---|---|---|---|
| #1 | Washington | Airplanes | $41.8 billion |
| #2 | Texas | Petroleum | $23.4 billion |
| #3 | Louisiana | Petroleum | $13.4 billion |
| #4 | New York | Diamonds | $12.2 billion |
| #5 | Kentucky | Airplanes | $11.6 billion |
| #6 | California | Airplanes | $7.1 billion |
| #7 | Florida | Airplanes | $6.3 billion |
| #8 | Nevada | Gold | $6.3 billion |
| #9 | South Carolina | Airplanes | $6.3 billion |
| #10 | Georgia | Airplanes | $5.8 billion |
Not surprisingly, some of the top national exports are represented here.
Airplanes dominate the list, and Boeing’s presence in particular is clearly felt. The company’s major factory in Everett, WA – the largest building in the world by volume – helps the state of Washington generate $41.8 billion in export sales from the aerospace sector. That said, airplanes are also the top export good for five other states in the above list.
The Gulf Coast is also well-represented with Texas and Louisiana as major refined oil exporters. New York (Diamonds) and Nevada (Gold) round out the list.
Keeping Exports Weird
The smaller the state, the better chance it has of specializing in a type of good that is outside of the norm.
Possibly the title of “Most Unusual Top State Export” can go to South Dakota, which sent $91 million of distillery dregs outside of the country in 2017. In case you were wondering, the U.S. Census Bureau’s full category title for this is as follows: BREWING OR DISTILLING DREGS AND WASTE, W/NT PELLET.
This spent grain is a byproduct of brewing or distilling processes, and is primarily sold for use in making animal feeds.
Other strange top exports?
The biggest state export of Wyoming is soda ash, which is used to manufacture of glass, paper, rayon, soaps, and detergents. In 2017, the state exported $842 million of soda ash, which is 10x larger than its second-biggest export category, which is also an uncommon one: rare gases.
Other interesting states include Rhode Island, which exported $187 million of iron and steel waste, as well as Maine – a state that shipped away $326 million of its famous lobsters.


Markets
U.S. Debt Interest Payments Reach $1 Trillion
U.S. debt interest payments have surged past the $1 trillion dollar mark, amid high interest rates and an ever-expanding debt burden.


U.S. Debt Interest Payments Reach $1 Trillion
This was originally posted on our Voronoi app. Download the app for free on iOS or Android and discover incredible data-driven charts from a variety of trusted sources.
The cost of paying for America’s national debt crossed the $1 trillion dollar mark in 2023, driven by high interest rates and a record $34 trillion mountain of debt.
Over the last decade, U.S. debt interest payments have more than doubled amid vast government spending during the pandemic crisis. As debt payments continue to soar, the Congressional Budget Office (CBO) reported that debt servicing costs surpassed defense spending for the first time ever this year.
This graphic shows the sharp rise in U.S. debt payments, based on data from the Federal Reserve.
A $1 Trillion Interest Bill, and Growing
Below, we show how U.S. debt interest payments have risen at a faster pace than at another time in modern history:
| Date | Interest Payments | U.S. National Debt |
|---|---|---|
| 2023 | $1.0T | $34.0T |
| 2022 | $830B | $31.4T |
| 2021 | $612B | $29.6T |
| 2020 | $518B | $27.7T |
| 2019 | $564B | $23.2T |
| 2018 | $571B | $22.0T |
| 2017 | $493B | $20.5T |
| 2016 | $460B | $20.0T |
| 2015 | $435B | $18.9T |
| 2014 | $442B | $18.1T |
| 2013 | $425B | $17.2T |
| 2012 | $417B | $16.4T |
| 2011 | $433B | $15.2T |
| 2010 | $400B | $14.0T |
| 2009 | $354B | $12.3T |
| 2008 | $380B | $10.7T |
| 2007 | $414B | $9.2T |
| 2006 | $387B | $8.7T |
| 2005 | $355B | $8.2T |
| 2004 | $318B | $7.6T |
| 2003 | $294B | $7.0T |
| 2002 | $298B | $6.4T |
| 2001 | $318B | $5.9T |
| 2000 | $353B | $5.7T |
| 1999 | $353B | $5.8T |
| 1998 | $360B | $5.6T |
| 1997 | $368B | $5.5T |
| 1996 | $362B | $5.3T |
| 1995 | $357B | $5.0T |
| 1994 | $334B | $4.8T |
| 1993 | $311B | $4.5T |
| 1992 | $306B | $4.2T |
| 1991 | $308B | $3.8T |
| 1990 | $298B | $3.4T |
| 1989 | $275B | $3.0T |
| 1988 | $254B | $2.7T |
| 1987 | $240B | $2.4T |
| 1986 | $225B | $2.2T |
| 1985 | $219B | $1.9T |
| 1984 | $205B | $1.7T |
| 1983 | $176B | $1.4T |
| 1982 | $157B | $1.2T |
| 1981 | $142B | $1.0T |
| 1980 | $113B | $930.2B |
| 1979 | $96B | $845.1B |
| 1978 | $84B | $789.2B |
| 1977 | $69B | $718.9B |
| 1976 | $61B | $653.5B |
| 1975 | $55B | $576.6B |
| 1974 | $50B | $492.7B |
| 1973 | $45B | $469.1B |
| 1972 | $39B | $448.5B |
| 1971 | $36B | $424.1B |
| 1970 | $35B | $389.2B |
| 1969 | $30B | $368.2B |
| 1968 | $25B | $358.0B |
| 1967 | $23B | $344.7B |
| 1966 | $21B | $329.3B |
Interest payments represent seasonally adjusted annual rate at the end of Q4.
At current rates, the U.S. national debt is growing by a remarkable $1 trillion about every 100 days, equal to roughly $3.6 trillion per year.
As the national debt has ballooned, debt payments even exceeded Medicaid outlays in 2023—one of the government’s largest expenditures. On average, the U.S. spent more than $2 billion per day on interest costs last year. Going further, the U.S. government is projected to spend a historic $12.4 trillion on interest payments over the next decade, averaging about $37,100 per American.
Exacerbating matters is that the U.S. is running a steep deficit, which stood at $1.1 trillion for the first six months of fiscal 2024. This has accelerated due to the 43% increase in debt servicing costs along with a $31 billion dollar increase in defense spending from a year earlier. Additionally, a $30 billion increase in funding for the Federal Deposit Insurance Corporation in light of the regional banking crisis last year was a major contributor to the deficit increase.
Overall, the CBO forecasts that roughly 75% of the federal deficit’s increase will be due to interest costs by 2034.

-

 Green1 week ago
Ranked: The Countries With the Most Air Pollution in 2023
-

 Automotive2 weeks ago
Almost Every EV Stock is Down After Q1 2024
-

 AI2 weeks ago
The Stock Performance of U.S. Chipmakers So Far in 2024
-

 Markets2 weeks ago
Charted: Big Four Market Share by S&P 500 Audits
-

 Real Estate2 weeks ago
Ranked: The Most Valuable Housing Markets in America
-

 Money2 weeks ago
Which States Have the Highest Minimum Wage in America?
-

 AI2 weeks ago
Ranked: Semiconductor Companies by Industry Revenue Share
-

 Travel2 weeks ago
Ranked: The World’s Top Flight Routes, by Revenue