Energy
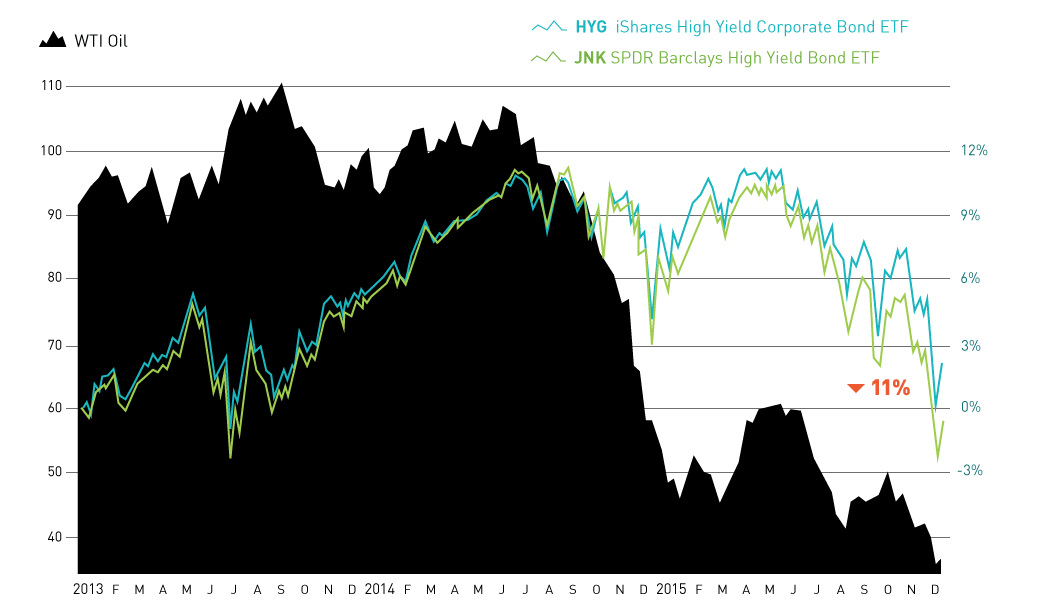
Junk Bonds Finally Capitulate to Lower Oil Price Environment [Chart]
![Junk Bonds Finally Capitulate to Lower Oil Price Environment [Chart]](https://www.visualcapitalist.com/wp-content/uploads/2015/12/junk-bonds-oil-chart.png)
Junk Bonds Finally Capitulate to Lower Oil Price Environment [Chart]
High-yield bond ETFs are down double-digits since the summer.
The Chart of the Week is a weekly Visual Capitalist feature on Fridays.
Over the month of December, the market for high-yield bonds (also known as junk bonds) had a mini-meltdown that’s raised some eyebrows.
Junk bonds, which are non-investment grade debt instruments that are issued by companies with poor credit ratings, are both high-risk and high-reward. If the companies don’t default on their payments, the bonds pay a nice premium to the investor. In fact, the risk and return on junk bonds is generally comparable with that of stocks.
However, sometimes these companies can and will default on their debt obligations, and here’s where the risk comes in. This time, it is the energy sector that is the culprit.
When low oil prices hit last year, many fringe oil and gas producers believed that it would be possible to wait out the market for better prices. Some of these companies even issued risky junk bonds to raise capital to sustain operations until better times.
The recent action in oil and commodity markets have made it clear that oil prices could be low for a long time. Now, these fringe shale producers that have been holding on for better times may get a different type of medicine.
Standard & Poor’s recently warned that a stunning 50% of energy junk bonds are “distressed,” meaning they are at risk of default. That’s about a total of $180 billion distressed debt, which is the highest level since the Financial Crisis.
Investors began pulling money out of the credit markets fast. Last week, investors pulled a record $5.1 billion out of mutual funds and ETFs investing in junk bonds. Investment-grade bond and junk bond yields are now at their highest since 2012.
On top of that, several funds announced they would be locking out investors from withdrawing their funds. Third Avenue has blocked investors from retrieving money from its credit fund, Stone Lion suspended redemptions in its credit hedge funds, and Lucidus Capital Partners liquidated its holdings to try and get money back to investors.
What does this mean for ordinary investors?
Jeffrey Gundlach, the “Bond King”, talked about this in his latest presentation for DoubleLine Capital:
I’m sure many people on the call have never seen the Fed raise rates. And I’ve got a simple message for you: It’s a different world when the Fed is raising interest rates. Everybody needs to unwind trades at the same time, and it is a completely different environment for the market.
In 2016 we will be sailing into some uncharted territory.


Energy
The World’s Biggest Nuclear Energy Producers
China has grown its nuclear capacity over the last decade, now ranking second on the list of top nuclear energy producers.


The World’s Biggest Nuclear Energy Producers
This was originally posted on our Voronoi app. Download the app for free on Apple or Android and discover incredible data-driven charts from a variety of trusted sources.
Scientists in South Korea recently broke a record in a nuclear fusion experiment. For 48 seconds, they sustained a temperature seven times that of the sun’s core.
But generating commercially viable energy from nuclear fusion still remains more science fiction than reality. Meanwhile, its more reliable sibling, nuclear fission, has been powering our world for many decades.
In this graphic, we visualized the top producers of nuclear energy by their share of the global total, measured in terawatt hours (TWh). Data for this was sourced from the Nuclear Energy Institute, last updated in August 2022.
Which Country Generates the Most Nuclear Energy?
Nuclear energy production in the U.S. is more than twice the amount produced by China (ranked second) and France (ranked third) put together. In total, the U.S. accounts for nearly 30% of global nuclear energy output.
However, nuclear power only accounts for one-fifth of America’s electricity supply. This is in contrast to France, which generates 60% of its electricity from nuclear plants.
| Rank | Country | Nuclear Energy Produced (TWh) | % of Total |
|---|---|---|---|
| 1 | 🇺🇸 U.S. | 772 | 29% |
| 2 | 🇨🇳 China | 383 | 14% |
| 3 | 🇫🇷 France | 363 | 14% |
| 4 | 🇷🇺 Russia | 208 | 8% |
| 5 | 🇰🇷 South Korea | 150 | 6% |
| 6 | 🇨🇦 Canada | 87 | 3% |
| 7 | 🇺🇦 Ukraine | 81 | 3% |
| 8 | 🇩🇪 Germany | 65 | 2% |
| 9 | 🇯🇵 Japan | 61 | 2% |
| 10 | 🇪🇸 Spain | 54 | 2% |
| 11 | 🇸🇪 Sweden | 51 | 2% |
| 12 | 🇧🇪 Belgium | 48 | 2% |
| 13 | 🇬🇧 UK | 42 | 2% |
| 14 | 🇮🇳 India | 40 | 2% |
| 15 | 🇨🇿 Czech Republic | 29 | 1% |
| N/A | 🌐 Other | 219 | 8% |
| N/A | 🌍 Total | 2,653 | 100% |
Another highlight is how China has rapidly grown its nuclear energy capabilities in the last decade. Between 2016 and 2021, for example, it increased its share of global nuclear energy output from less than 10% to more than 14%, overtaking France for second place.
On the opposite end, the UK’s share has slipped to 2% over the same time period.
Meanwhile, Ukraine has heavily relied on nuclear energy to power its grid. In March 2022, it lost access to its key Zaporizhzhia Nuclear Power Station after Russian forces wrested control of the facility. With six 1,000 MW reactors, the plant is one of the largest in Europe. It is currently not producing any power, and has been the site of recent drone attacks.

-

 Mining2 weeks ago
Charted: The Value Gap Between the Gold Price and Gold Miners
-

 Real Estate1 week ago
Ranked: The Most Valuable Housing Markets in America
-

 Business1 week ago
Charted: Big Four Market Share by S&P 500 Audits
-

 AI1 week ago
The Stock Performance of U.S. Chipmakers So Far in 2024
-

 Misc1 week ago
Almost Every EV Stock is Down After Q1 2024
-

 Money2 weeks ago
Where Does One U.S. Tax Dollar Go?
-

 Green2 weeks ago
Ranked: Top Countries by Total Forest Loss Since 2001
-

 Real Estate2 weeks ago
Visualizing America’s Shortage of Affordable Homes