Mining
It’s Time to Pile Back Into Gold Stocks [Charts]
The blessing and curse of being a contrarian is this: an inevitable outcome is recognized well before it comes to fruition. Even though profitable opportunities may be identified well in advance, it can take so long for hallmark events such as capitulation to happen, that it gives ample time to second guess one’s convictions.
We’ve believed, even before the correction that has recently hit U.S. markets, that the bear market for gold was long in the tooth. With asset bubbles all over the place, it has seemed for awhile that gold and silver were the only assets that were reasonably priced. Then yesterday, our friends at Palisade Capital sent us over five charts on why they believe that gold stocks are the most undervalued that they have been in decades.
We tend to agree with that sentiment, which is why in last week’s chart of the week we predicted that gold had already bottomed and that it had nowhere to go but up. (We further predicted that other commodities such as base metals would continue to get routed for the time being, and that U.S. equities would not return to the same levels for awhile.)
In any case, here are the charts:
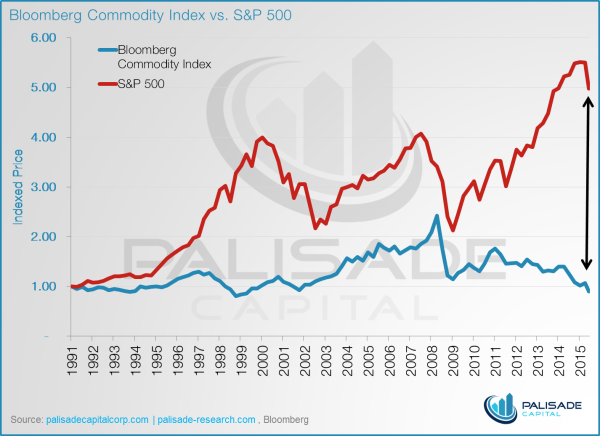
1. The divergence between the S&P 500 and Bloomberg Commodity Index is at an all-time high.
2. The bear market in the TSX Venture now stands at 1,090+ days.
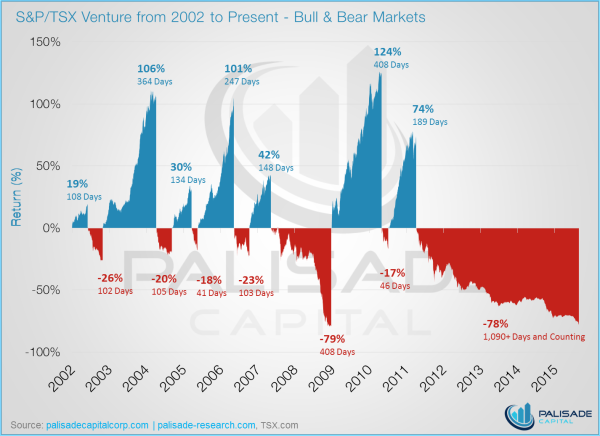
The TSX Venture, the Canadian home to the majority of the world’s junior mining stocks, is still plagued with plenty of zombie stocks that amount to billions of dollars of negative working capital. The exchange and regulators have also been readily criticized for recent changes that limit access to capital from retail investors. However, in spite of all of this, there are truly some great projects and assets lying in some of the companies that have survived the onslaught. As you’ll see in the next chart, these companies have never been more undervalued.
3. Gold stocks have never been this cheap relative to the price of gold.
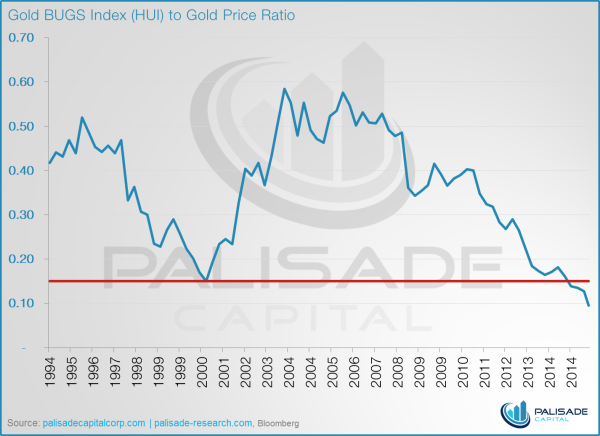
The Gold BUGS Index (HUI), which tracks the world’s largest gold miners, was last this low when gold was only $250/oz.
4. The gold bear market is closing in on being the longest in BGMI history.
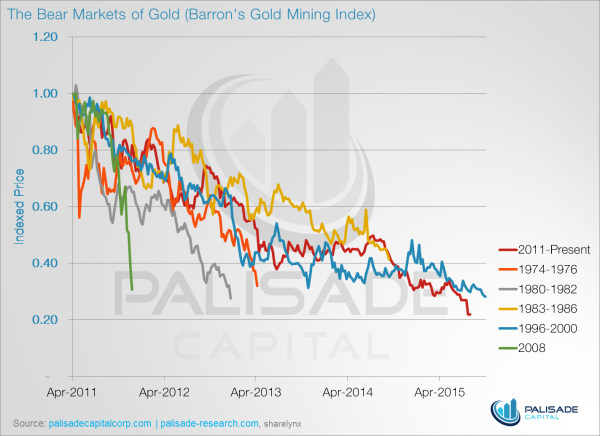
Using the Barron’s Gold Mining Index (BGMI), this is already the worst bear market for gold miners. However, in just a couple of months, it will also surpass the 1996-2000 bear market as the longest.
5. The ratio between the gold/silver sector to the S&P 500 is unprecedented.
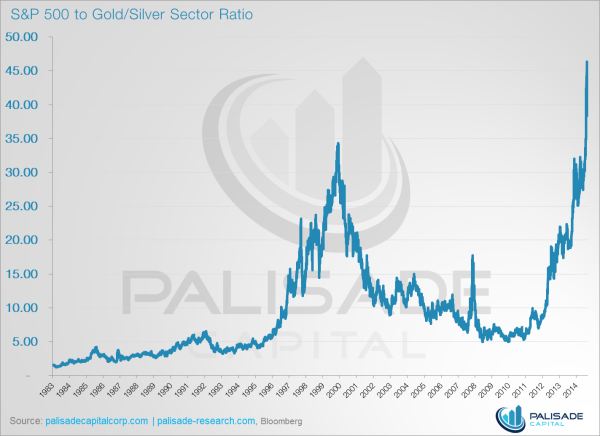
When pricing the S&P 500 in terms of the Gold/Silver Sector Index (XAU), it has never been this expensive. Put another way: gold and silver has never been this cheap.
Chart credit to: Palisade Research and The Daily Gold
Lithium
Ranked: The Top 10 EV Battery Manufacturers in 2023
Asia dominates this ranking of the world’s largest EV battery manufacturers in 2023.

The Top 10 EV Battery Manufacturers in 2023
This was originally posted on our Voronoi app. Download the app for free on iOS or Android and discover incredible data-driven charts from a variety of trusted sources.
Despite efforts from the U.S. and EU to secure local domestic supply, all major EV battery manufacturers remain based in Asia.
In this graphic we rank the top 10 EV battery manufacturers by total battery deployment (measured in megawatt-hours) in 2023. The data is from EV Volumes.
Chinese Dominance
Contemporary Amperex Technology Co. Limited (CATL) has swiftly risen in less than a decade to claim the title of the largest global battery group.
The Chinese company now has a 34% share of the market and supplies batteries to a range of made-in-China vehicles, including the Tesla Model Y, SAIC’s MG4/Mulan, and various Li Auto models.
| Company | Country | 2023 Production (megawatt-hour) | Share of Total Production |
|---|---|---|---|
| CATL | 🇨🇳 China | 242,700 | 34% |
| BYD | 🇨🇳 China | 115,917 | 16% |
| LG Energy Solution | 🇰🇷 Korea | 108,487 | 15% |
| Panasonic | 🇯🇵 Japan | 56,560 | 8% |
| SK On | 🇰🇷 Korea | 40,711 | 6% |
| Samsung SDI | 🇰🇷 Korea | 35,703 | 5% |
| CALB | 🇨🇳 China | 23,493 | 3% |
| Farasis Energy | 🇨🇳 China | 16,527 | 2% |
| Envision AESC | 🇨🇳 China | 8,342 | 1% |
| Sunwoda | 🇨🇳 China | 6,979 | 1% |
| Other | - | 56,040 | 8% |
In 2023, BYD surpassed LG Energy Solution to claim second place. This was driven by demand from its own models and growth in third-party deals, including providing batteries for the made-in-Germany Tesla Model Y, Toyota bZ3, Changan UNI-V, Venucia V-Online, as well as several Haval and FAW models.
The top three battery makers (CATL, BYD, LG) collectively account for two-thirds (66%) of total battery deployment.
Once a leader in the EV battery business, Panasonic now holds the fourth position with an 8% market share, down from 9% last year. With its main client, Tesla, now sourcing batteries from multiple suppliers, the Japanese battery maker seems to be losing its competitive edge in the industry.
Overall, the global EV battery market size is projected to grow from $49 billion in 2022 to $98 billion by 2029, according to Fortune Business Insights.
-

 Markets1 week ago
U.S. Debt Interest Payments Reach $1 Trillion
-

 Markets2 weeks ago
Charted: Big Four Market Share by S&P 500 Audits
-

 Markets2 weeks ago
Ranked: The Most Valuable Housing Markets in America
-

 Money2 weeks ago
Which States Have the Highest Minimum Wage in America?
-

 AI2 weeks ago
Ranked: Semiconductor Companies by Industry Revenue Share
-

 Markets2 weeks ago
Ranked: The World’s Top Flight Routes, by Revenue
-

 Countries2 weeks ago
Population Projections: The World’s 6 Largest Countries in 2075
-

 Markets2 weeks ago
The Top 10 States by Real GDP Growth in 2023


