Markets
How Investment Goals Vary by Country and Age
How Investment Goals Vary by Country and Age
It goes without saying that investors want to see their money grow.
However, it turns out that why investors want their money to grow changes considerably, depending on who you are talking to.
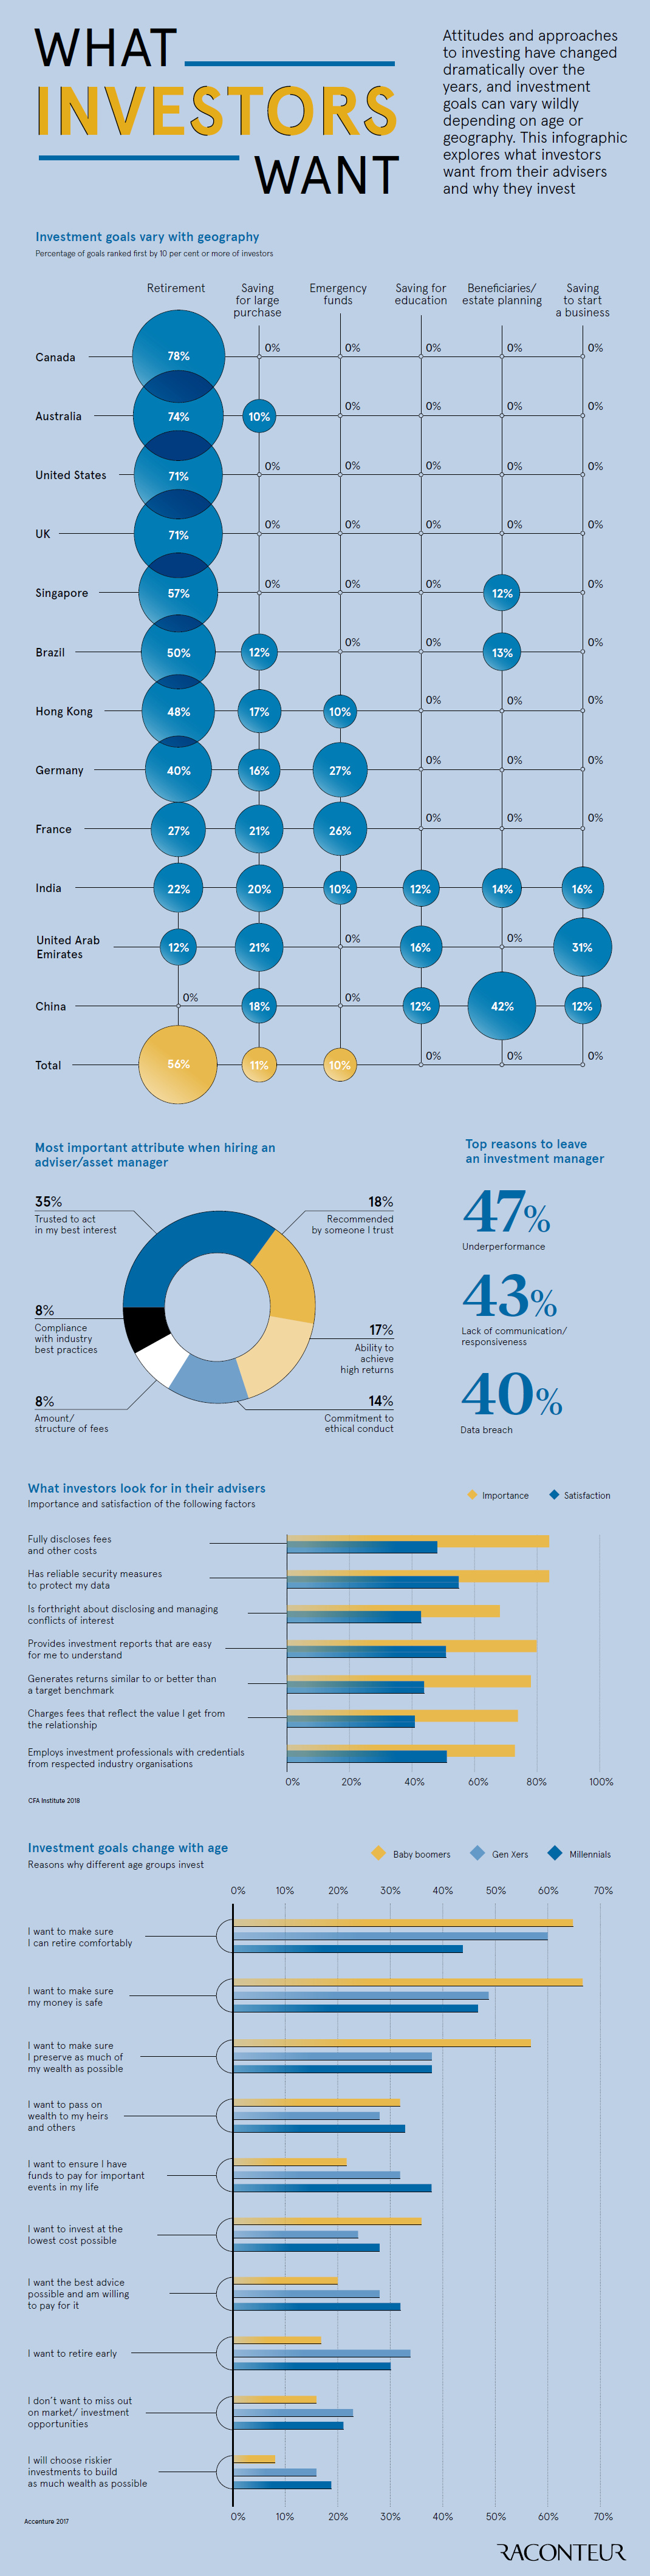
Investment Goals by Geography
Today’s infographic from Raconteur first shows why people invest based on country of residence.
In the following table, we’ll show selected data to illustrate an interesting contrast between North American, Asian, and European cultures:
| Country | Primary Investing Goal | Percentage |
|---|---|---|
| Canada | Saving for retirement | 78% |
| USA | Saving for retirement | 71% |
| UK | Saving for retirement | 71% |
| Hong Kong | Saving for retirement | 48% |
| Germany | Saving for retirement | 40% |
| France | Saving for retirement | 27% |
| UAE | Saving to start a business | 31% |
| China | Beneficiaries / estate planning | 42% |
In Canada, the United States, and the United Kingdom, saving for retirement is the primary investment goal for 70% or more of all respondents. However, in Europe and Asia, there is a much wider diversity of investment goals.
In Germany and France, for example, close to a quarter of respondents mentioned that saving for an emergency was their primary goal, behind saving for retirement. Meanwhile, in the UAE and in China, the primary investment goal was not retirement – it was instead saving to start a business (UAE) and setting up family and/or beneficiaries for success (China).
Goals by Generation
It’s not just geographical boundaries, the level of economic development, and the local culture that impacts investment goals.
Another factor is generational: Baby Boomers, Gen Xers, and Millennials are at very different stages of life, and each generation has their own quirky preferences, anyway.
| Statement (I want to…) | Highest Agreeance | Lowest agreeance |
|---|---|---|
| Retire comfortably | Boomers | Millennials |
| Make sure money is safe | Boomers | Millennials |
| Preserve as much wealth as possible | Boomers | Millennials |
| Pass on wealth to my heirs and others | Millennials | Gen Xers |
| Ensure I have funds to pay for important events | Millennials | Boomers |
| Invest at the lowest cost possible | Boomers | Gen Xers |
| Have the best advice possible and am willing to pay | Millennials | Boomers |
| Retire early | Gen Xers | Boomers |
| Not miss out on market opportunities | Gen Xers | Boomers |
| Choose riskier investments to build wealth fast | Millennials | Boomers |
Not surprisingly, as people get older, their goals shift away from making immediate big-ticket purchases, and holding riskier investments for a higher rate of return. Later on in life, goals are more focused on retirement and maximizing wealth.
That said, there are some anomalies in the above data that are interesting.
For example, Millennials – not Baby Boomers – are most concerned about building wealth to pass onto their heirs. Finally, it is the Millennials that are willing to pay the most for investment advice, in order to get the best possible result.


Markets
U.S. Debt Interest Payments Reach $1 Trillion
U.S. debt interest payments have surged past the $1 trillion dollar mark, amid high interest rates and an ever-expanding debt burden.


U.S. Debt Interest Payments Reach $1 Trillion
This was originally posted on our Voronoi app. Download the app for free on iOS or Android and discover incredible data-driven charts from a variety of trusted sources.
The cost of paying for America’s national debt crossed the $1 trillion dollar mark in 2023, driven by high interest rates and a record $34 trillion mountain of debt.
Over the last decade, U.S. debt interest payments have more than doubled amid vast government spending during the pandemic crisis. As debt payments continue to soar, the Congressional Budget Office (CBO) reported that debt servicing costs surpassed defense spending for the first time ever this year.
This graphic shows the sharp rise in U.S. debt payments, based on data from the Federal Reserve.
A $1 Trillion Interest Bill, and Growing
Below, we show how U.S. debt interest payments have risen at a faster pace than at another time in modern history:
| Date | Interest Payments | U.S. National Debt |
|---|---|---|
| 2023 | $1.0T | $34.0T |
| 2022 | $830B | $31.4T |
| 2021 | $612B | $29.6T |
| 2020 | $518B | $27.7T |
| 2019 | $564B | $23.2T |
| 2018 | $571B | $22.0T |
| 2017 | $493B | $20.5T |
| 2016 | $460B | $20.0T |
| 2015 | $435B | $18.9T |
| 2014 | $442B | $18.1T |
| 2013 | $425B | $17.2T |
| 2012 | $417B | $16.4T |
| 2011 | $433B | $15.2T |
| 2010 | $400B | $14.0T |
| 2009 | $354B | $12.3T |
| 2008 | $380B | $10.7T |
| 2007 | $414B | $9.2T |
| 2006 | $387B | $8.7T |
| 2005 | $355B | $8.2T |
| 2004 | $318B | $7.6T |
| 2003 | $294B | $7.0T |
| 2002 | $298B | $6.4T |
| 2001 | $318B | $5.9T |
| 2000 | $353B | $5.7T |
| 1999 | $353B | $5.8T |
| 1998 | $360B | $5.6T |
| 1997 | $368B | $5.5T |
| 1996 | $362B | $5.3T |
| 1995 | $357B | $5.0T |
| 1994 | $334B | $4.8T |
| 1993 | $311B | $4.5T |
| 1992 | $306B | $4.2T |
| 1991 | $308B | $3.8T |
| 1990 | $298B | $3.4T |
| 1989 | $275B | $3.0T |
| 1988 | $254B | $2.7T |
| 1987 | $240B | $2.4T |
| 1986 | $225B | $2.2T |
| 1985 | $219B | $1.9T |
| 1984 | $205B | $1.7T |
| 1983 | $176B | $1.4T |
| 1982 | $157B | $1.2T |
| 1981 | $142B | $1.0T |
| 1980 | $113B | $930.2B |
| 1979 | $96B | $845.1B |
| 1978 | $84B | $789.2B |
| 1977 | $69B | $718.9B |
| 1976 | $61B | $653.5B |
| 1975 | $55B | $576.6B |
| 1974 | $50B | $492.7B |
| 1973 | $45B | $469.1B |
| 1972 | $39B | $448.5B |
| 1971 | $36B | $424.1B |
| 1970 | $35B | $389.2B |
| 1969 | $30B | $368.2B |
| 1968 | $25B | $358.0B |
| 1967 | $23B | $344.7B |
| 1966 | $21B | $329.3B |
Interest payments represent seasonally adjusted annual rate at the end of Q4.
At current rates, the U.S. national debt is growing by a remarkable $1 trillion about every 100 days, equal to roughly $3.6 trillion per year.
As the national debt has ballooned, debt payments even exceeded Medicaid outlays in 2023—one of the government’s largest expenditures. On average, the U.S. spent more than $2 billion per day on interest costs last year. Going further, the U.S. government is projected to spend a historic $12.4 trillion on interest payments over the next decade, averaging about $37,100 per American.
Exacerbating matters is that the U.S. is running a steep deficit, which stood at $1.1 trillion for the first six months of fiscal 2024. This has accelerated due to the 43% increase in debt servicing costs along with a $31 billion dollar increase in defense spending from a year earlier. Additionally, a $30 billion increase in funding for the Federal Deposit Insurance Corporation in light of the regional banking crisis last year was a major contributor to the deficit increase.
Overall, the CBO forecasts that roughly 75% of the federal deficit’s increase will be due to interest costs by 2034.

-

 Misc1 week ago
Airline Incidents: How Do Boeing and Airbus Compare?
-

 Real Estate3 weeks ago
Visualizing America’s Shortage of Affordable Homes
-

 Green2 weeks ago
Ranked: Top Countries by Total Forest Loss Since 2001
-

 Money2 weeks ago
Where Does One U.S. Tax Dollar Go?
-

 Misc2 weeks ago
Almost Every EV Stock is Down After Q1 2024
-

 AI2 weeks ago
The Stock Performance of U.S. Chipmakers So Far in 2024
-

 Business2 weeks ago
Charted: Big Four Market Share by S&P 500 Audits
-

 Real Estate2 weeks ago
Ranked: The Most Valuable Housing Markets in America