Energy
Interactive: Tracking the Energy Titans
Interactive: Tracking the Energy Titans
Comparing USA, China, and Canada in terms of energy
Today’s interactive infographic comes to us from the Wilson Center, a non-partisan think tank based in Washington, D.C.
This in-depth series of charts and data extensively covers energy consumption, production, imports, and exports in three different countries: China, Canada and the United States. These energy titans all have significantly different economies, so the comparison becomes very interesting.
China is the world’s engine and has over a billion people within its borders. The United States has the most advanced and diversified economy, but has about a third of the population. Canada is an advanced economy that is also a significant energy exporter, but it only has 10% of the population of the United States.
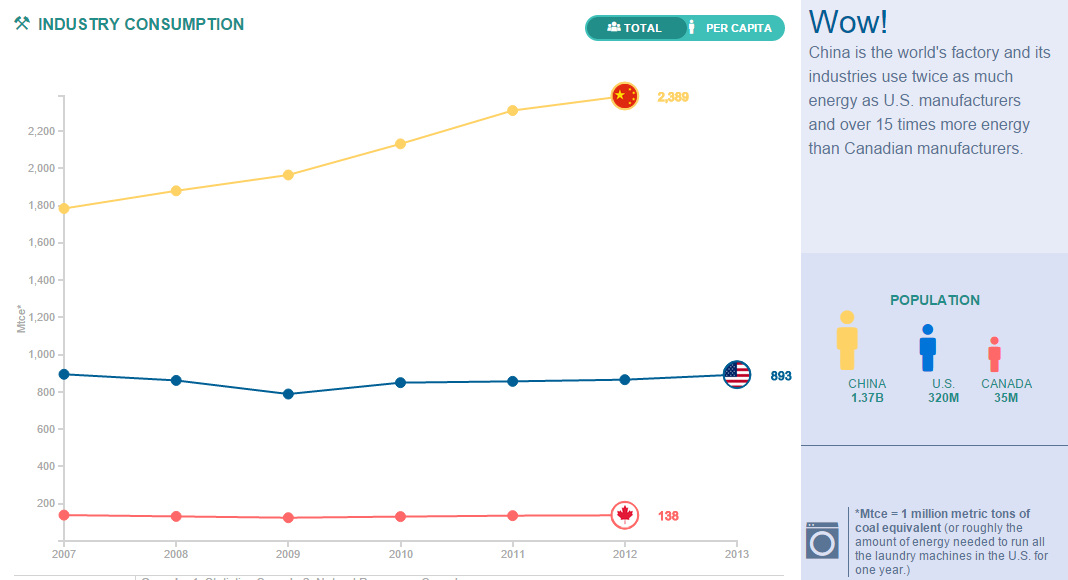
The interactive infographic is split into five different tabs: production, imports, exports, consumption, and impact. Within each tab, there are options to look at data on different energy sources and types of consumption (industrial, residential, commercial). Lastly, the charts can also be displayed in terms of total numbers or per capita.
The factoids come fast and furious on the right-hand section. Here’s a few we liked:
- The domestic oil boom in the United States has cut the need to import oil products by 40 percent since 2007.
- China is the world’s factory and its industries use twice as much energy as U.S. manufacturers and over 15 times more energy than Canadian manufacturers.
- 82 percent of electricity in China comes from coal, pushing total consumption above the United States for the first time in 2011. But per capita consumption levels are far off when spread out over China’s 1.37 billion people.
- In aggregate, U.S. drivers use 16 times more energy in transportation than their Chinese counterparts.
- China leads the world in coal-fired power plants, one of the “thirstiest” methods of power generation. U.S. generation from coal has dropped precipitously since 2008, but coal and nuclear power plants still accounted for 37 percent of all water used in 2012.
There are some enlightening facts here, especially when looking at a “per capita” perspective. As China develops into a more sophisticated economy with a bigger middle class, the country’s already astounding numbers will grow even more.
For commodity bulls, it is a reminder that there is still a lot of room left for growth on the demand side of the equation – it just may take longer than hoped.


Energy
The World’s Biggest Nuclear Energy Producers
China has grown its nuclear capacity over the last decade, now ranking second on the list of top nuclear energy producers.


The World’s Biggest Nuclear Energy Producers
This was originally posted on our Voronoi app. Download the app for free on Apple or Android and discover incredible data-driven charts from a variety of trusted sources.
Scientists in South Korea recently broke a record in a nuclear fusion experiment. For 48 seconds, they sustained a temperature seven times that of the sun’s core.
But generating commercially viable energy from nuclear fusion still remains more science fiction than reality. Meanwhile, its more reliable sibling, nuclear fission, has been powering our world for many decades.
In this graphic, we visualized the top producers of nuclear energy by their share of the global total, measured in terawatt hours (TWh). Data for this was sourced from the Nuclear Energy Institute, last updated in August 2022.
Which Country Generates the Most Nuclear Energy?
Nuclear energy production in the U.S. is more than twice the amount produced by China (ranked second) and France (ranked third) put together. In total, the U.S. accounts for nearly 30% of global nuclear energy output.
However, nuclear power only accounts for one-fifth of America’s electricity supply. This is in contrast to France, which generates 60% of its electricity from nuclear plants.
| Rank | Country | Nuclear Energy Produced (TWh) | % of Total |
|---|---|---|---|
| 1 | 🇺🇸 U.S. | 772 | 29% |
| 2 | 🇨🇳 China | 383 | 14% |
| 3 | 🇫🇷 France | 363 | 14% |
| 4 | 🇷🇺 Russia | 208 | 8% |
| 5 | 🇰🇷 South Korea | 150 | 6% |
| 6 | 🇨🇦 Canada | 87 | 3% |
| 7 | 🇺🇦 Ukraine | 81 | 3% |
| 8 | 🇩🇪 Germany | 65 | 2% |
| 9 | 🇯🇵 Japan | 61 | 2% |
| 10 | 🇪🇸 Spain | 54 | 2% |
| 11 | 🇸🇪 Sweden | 51 | 2% |
| 12 | 🇧🇪 Belgium | 48 | 2% |
| 13 | 🇬🇧 UK | 42 | 2% |
| 14 | 🇮🇳 India | 40 | 2% |
| 15 | 🇨🇿 Czech Republic | 29 | 1% |
| N/A | 🌐 Other | 219 | 8% |
| N/A | 🌍 Total | 2,653 | 100% |
Another highlight is how China has rapidly grown its nuclear energy capabilities in the last decade. Between 2016 and 2021, for example, it increased its share of global nuclear energy output from less than 10% to more than 14%, overtaking France for second place.
On the opposite end, the UK’s share has slipped to 2% over the same time period.
Meanwhile, Ukraine has heavily relied on nuclear energy to power its grid. In March 2022, it lost access to its key Zaporizhzhia Nuclear Power Station after Russian forces wrested control of the facility. With six 1,000 MW reactors, the plant is one of the largest in Europe. It is currently not producing any power, and has been the site of recent drone attacks.

-

 Green2 weeks ago
Ranked: Top Countries by Total Forest Loss Since 2001
-

 Travel1 week ago
Ranked: The World’s Top Flight Routes, by Revenue
-

 Technology1 week ago
Ranked: Semiconductor Companies by Industry Revenue Share
-

 Money2 weeks ago
Which States Have the Highest Minimum Wage in America?
-

 Real Estate2 weeks ago
Ranked: The Most Valuable Housing Markets in America
-

 Markets2 weeks ago
Charted: Big Four Market Share by S&P 500 Audits
-

 AI2 weeks ago
The Stock Performance of U.S. Chipmakers So Far in 2024
-

 Automotive2 weeks ago
Almost Every EV Stock is Down After Q1 2024