Technology
Visualizing Major Tech Acquisitions (1991-2018)
Launch the interactive version below, or go to our story for simpler, static images
Interactive: Visualizing Major Tech Acquisitions (1991-2018)
To stay successful in tech, companies must find a way to walk alongside the cutting edge of innovation.
Companies do this partially by devoting a large portion of their resources towards research and development (R&D) – but to hedge their bets, these companies also are in constant negotiations to gobble up new startups that could be strategic to their futures.
In this giant game of Pac-Man, most of the acquisitions are small and sequential, just like the dots that make up the arcade game’s classic maze. That said, sometimes these tech giants get lucky, such as in Facebook’s acquisition of Instagram, and buyouts turn into power-ups that can change the dynamics of the game entirely.
Tech Acquisitions by Company
Today’s interactive infographic comes to us from IG and it allows you to compare the tech acquisitions made by dominant companies such as Facebook, Apple, IBM, or Cisco.
Acquisitions can be sorted by industry filters (i.e. e-commerce, security, etc.) and different acquiring companies can be switched in. There are also different tabs that show total M&A expenditures by company, M&A activity by CEO, and frequency of acquisitions measured in quantity per year.
The Big Picture
Before we go into specific acquisitions, let’s look at the big picture using images pulled from the interactive version of the graphic.
Here is a comparison of the number of acquisitions made since 1991, for each major company on the list:
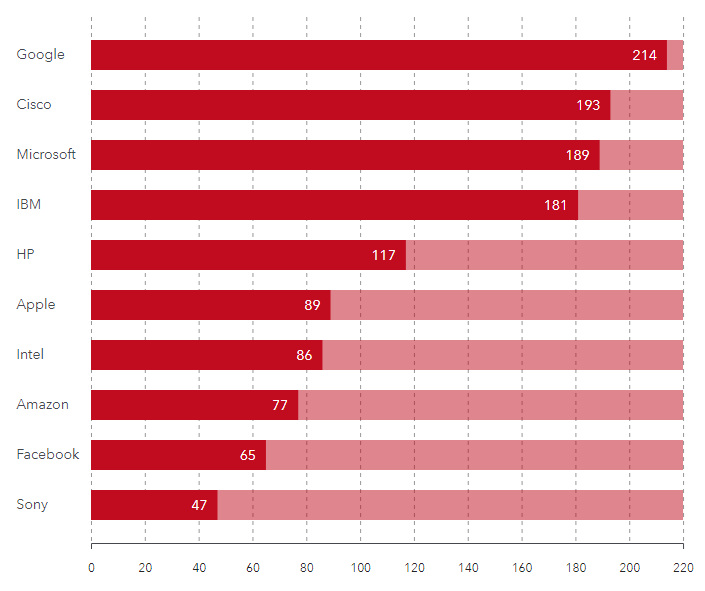
Google has made the most acquisitions, averaging about 10 to 11 per year. That adds up to a total of 214 since the company was founded.
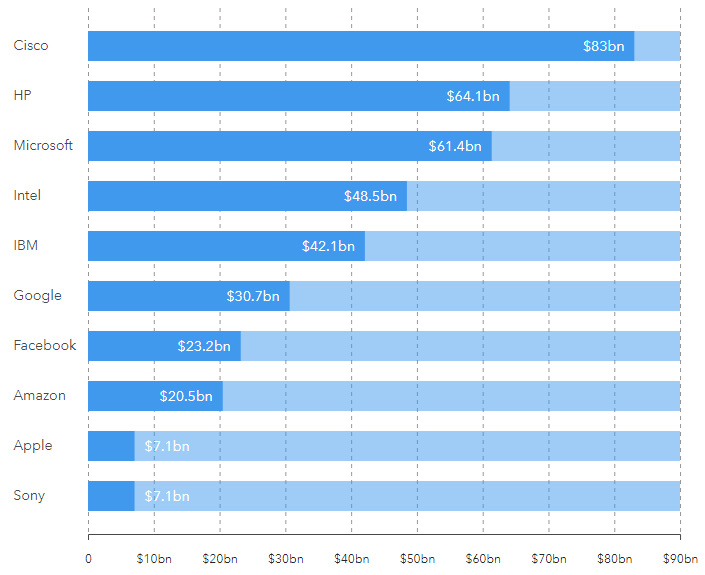
Interestingly, while Google has had the most acquisitions, it only ranks in 6th out of this group in terms of dollars spent. Giants like Microsoft, Cisco, and IBM may make fewer acquisitions, but the companies they do buy tend to be more established with higher valuations.
As an example of this: Microsoft bought LinkedIn in 2016 for $26.2 billion. That’s more than Amazon has spent on all of its acquisitions (including Whole Foods) combined.
The Big Five
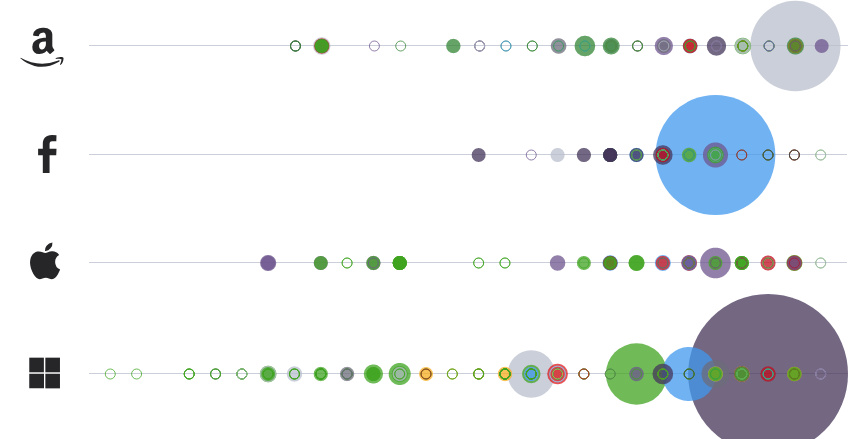
Finally, here’s a comparison of the big five – Amazon, Apple, Microsoft, Facebook, and Google (Alphabet) – which are also the five largest companies by market capitalization in the United States.
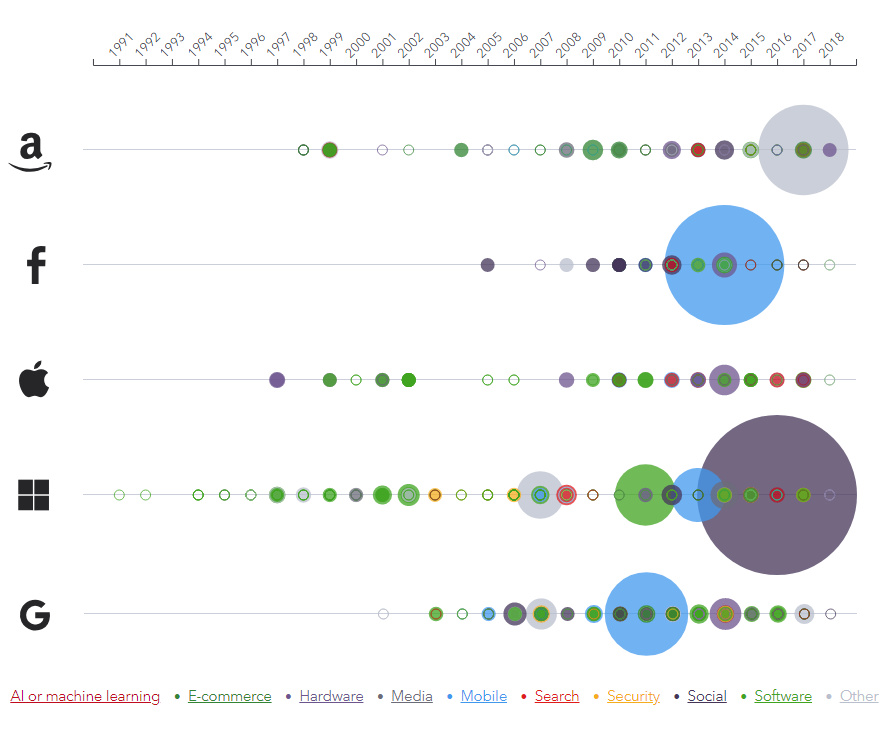
On the interactive version, it’s possible to highlight each acquisition to get the deal value and company name.
But, even on the static version above, it’s noticeable that each of the Big Five has made at least one real sizable acquisition. Those are the circles that stand out the most on the timeline:
- 2011: Google buys Motorola for $12.5 billion
- 2014: Facebook buys WhatsApp for $19 billion, and Apple buys Beats for $3 billion
- 2016: Microsoft buys LinkedIn for $26.2 billion
- 2017: Amazon buys Whole Foods for $13.7 billion
The gobbling activity for these Big Five has continued into 2018, as well.
In fact, just in June 2018, Microsoft announced the acquisition of code repository GitHub for $7.5 billion. The deal is expected to close by the end of the year.


Technology
Visualizing AI Patents by Country
See which countries have been granted the most AI patents each year, from 2012 to 2022.


Visualizing AI Patents by Country
This was originally posted on our Voronoi app. Download the app for free on iOS or Android and discover incredible data-driven charts from a variety of trusted sources.
This infographic shows the number of AI-related patents granted each year from 2010 to 2022 (latest data available). These figures come from the Center for Security and Emerging Technology (CSET), accessed via Stanford University’s 2024 AI Index Report.
From this data, we can see that China first overtook the U.S. in 2013. Since then, the country has seen enormous growth in the number of AI patents granted each year.
| Year | China | EU and UK | U.S. | RoW | Global Total |
|---|---|---|---|---|---|
| 2010 | 307 | 137 | 984 | 571 | 1,999 |
| 2011 | 516 | 129 | 980 | 581 | 2,206 |
| 2012 | 926 | 112 | 950 | 660 | 2,648 |
| 2013 | 1,035 | 91 | 970 | 627 | 2,723 |
| 2014 | 1,278 | 97 | 1,078 | 667 | 3,120 |
| 2015 | 1,721 | 110 | 1,135 | 539 | 3,505 |
| 2016 | 1,621 | 128 | 1,298 | 714 | 3,761 |
| 2017 | 2,428 | 144 | 1,489 | 1,075 | 5,136 |
| 2018 | 4,741 | 155 | 1,674 | 1,574 | 8,144 |
| 2019 | 9,530 | 322 | 3,211 | 2,720 | 15,783 |
| 2020 | 13,071 | 406 | 5,441 | 4,455 | 23,373 |
| 2021 | 21,907 | 623 | 8,219 | 7,519 | 38,268 |
| 2022 | 35,315 | 1,173 | 12,077 | 13,699 | 62,264 |
In 2022, China was granted more patents than every other country combined.
While this suggests that the country is very active in researching the field of artificial intelligence, it doesn’t necessarily mean that China is the farthest in terms of capability.
Key Facts About AI Patents
According to CSET, AI patents relate to mathematical relationships and algorithms, which are considered abstract ideas under patent law. They can also have different meaning, depending on where they are filed.
In the U.S., AI patenting is concentrated amongst large companies including IBM, Microsoft, and Google. On the other hand, AI patenting in China is more distributed across government organizations, universities, and tech firms (e.g. Tencent).
In terms of focus area, China’s patents are typically related to computer vision, a field of AI that enables computers and systems to interpret visual data and inputs. Meanwhile America’s efforts are more evenly distributed across research fields.
Learn More About AI From Visual Capitalist
If you want to see more data visualizations on artificial intelligence, check out this graphic that shows which job departments will be impacted by AI the most.

-

 Markets1 week ago
U.S. Debt Interest Payments Reach $1 Trillion
-

 Business2 weeks ago
Charted: Big Four Market Share by S&P 500 Audits
-

 Real Estate2 weeks ago
Ranked: The Most Valuable Housing Markets in America
-

 Money2 weeks ago
Which States Have the Highest Minimum Wage in America?
-

 AI2 weeks ago
Ranked: Semiconductor Companies by Industry Revenue Share
-

 Markets2 weeks ago
Ranked: The World’s Top Flight Routes, by Revenue
-

 Demographics2 weeks ago
Population Projections: The World’s 6 Largest Countries in 2075
-

 Markets2 weeks ago
The Top 10 States by Real GDP Growth in 2023