Markets
Intangible Assets: A Hidden but Crucial Driver of Company Value
View the full-size version of this infographic.

Intangible Assets Take Center Stage
View the high resolution version of this infographic by clicking here
In 2018, intangible assets for S&P 500 companies hit a record value of $21 trillion. These assets, which are not physical in nature and include things like intellectual property, have rapidly risen in importance compared to tangible assets like cash.
Today’s infographic from Raconteur highlights the growth of intangible asset valuations, and how senior decision-makers view intangibles when making investment decisions.
Tracking the Growth of Intangibles
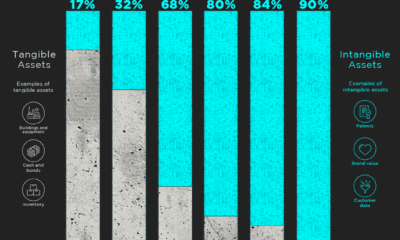
Intangibles used to play a much smaller role than they do now, with physical assets comprising the majority of value for most enterprise companies. However, an increasingly competitive and digital economy has placed the focus on things like intellectual property, as companies race to out-innovate one another.
To measure this historical shift, Aon and the Ponemon Institute analyzed the value of intangible and tangible assets over nearly four and a half decades on the S&P 500. Here’s how they stack up:
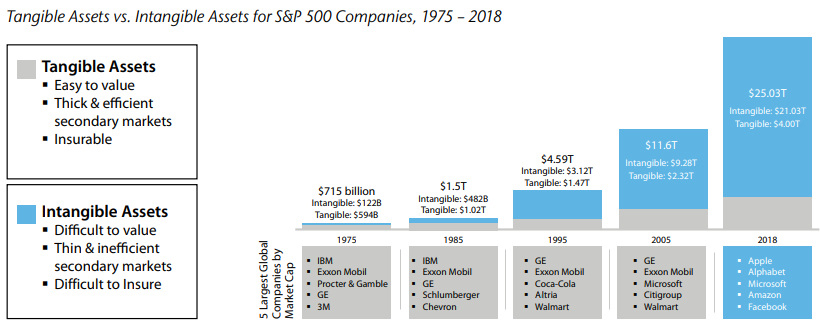
Source: Aon
In just 43 years, intangibles have evolved from a supporting asset into a major consideration for investors – today, they make up 84% of all enterprise value on the S&P 500, a massive increase from just 17% in 1975.
The Largest Companies by Intangible Value
Digital-centric sectors, such as internet & software and technology & IT, are heavily reliant on intangible assets.
Brand Finance, which produces an annual ranking of companies based on intangible value, has companies in these sectors taking the top five spots on the 2019 edition of their report.
| Rank | Company | Sector | Total Intangible Value | Share of Enterprise Value |
|---|---|---|---|---|
| 1 | Microsoft | Internet & Software | $904B | 90% |
| 2 | Amazon | Internet & Software | $839B | 93% |
| 3 | Apple | Technology & IT | $675B | 77% |
| 4 | Alphabet | Internet & Software | $521B | 65% |
| 5 | Internet & Software | $409B | 79% | |
| 6 | AT&T | Telecoms | $371B | 84% |
| 7 | Tencent | Internet & Software | $365B | 88% |
| 8 | Johnson & Johnson | Pharma | $361B | 101% |
| 9 | Visa | Banking | $348B | 100% |
| 10 | Alibaba | Internet & Software | $344B | 86% |
| 11 | Nestle | Food | $313B | 89% |
| 12 | Procter & Gamble | Cosmetics & Personal Care | $305B | 101% |
| 13 | Anheuser-Busch InBev | Beers | $304B | 99% |
| 14 | Verizon | Telecoms | $300B | 83% |
| 15 | Comcast | Media | $276B | 92% |
| 16 | Mastercard | Banking | $259B | 99% |
| 17 | Novartis | Pharma | $252B | 101% |
| 18 | Walmart | Retail | $252B | 68% |
| 19 | Unitedhealth | Healthcare | $245B | 94% |
| 20 | Pfizer | Pharma | $235B | 98% |
Note: Percentages may exceed 100% due to rounding.
Microsoft overtook Amazon for the top spot in the ranking for 2019, with $904B in intangible assets. The company has the largest commercial cloud business in the world.
Pharma and healthcare companies are also prominent on the list, comprising four of the top 20. Their intangible value is largely driven by patents, as well as mergers and acquisitions. Johnson & Johnson, for example, reported $32B in patents and trademarks in their latest annual report.
A Lack of Disclosure
It’s important to note that Brand Finance’s ranking is based on both disclosed intangibles—those that are reported on a company’s balance sheet—and undisclosed intangibles. In the ranking, undisclosed intangibles were calculated as the difference between a company’s market value and book value.
The majority of intangibles are not reported on balance sheets because accounting standards do not recognize them until a transaction has occurred to support their value. While many accounting managers see this as a prudent measure to stop unsubstantiated asset values, it means that many highly valuable intangibles never appear in financial reporting. In fact, 34% of the total worth of the world’s publicly traded companies is made up of undisclosed value.
“It is time for CEOs, CFOs, and CMOs to start a long overdue reporting revolution.”
—David Haigh, CEO of Brand Finance
Brand Finance believes that companies should regularly value each intangible asset, including the key assumptions management made when deriving their value. This information would be extremely useful for managers, investors, and other stakeholders.
A Key Consideration
Investment professionals certainly agree on the importance of intangibles. In a survey of institutional investors by Columbia Threadneedle, it was found that 95% agreed that intangible assets contain crucial information about the future strength of a company’s business model.
Moreover, 98% agree that more transparency would be beneficial to their assessment of intangible assets. In the absence of robust reporting, Columbia Threadneedle believes active managers are well equipped to understand intangible asset values due to their access to management, relationships with key opinion leaders, and deep industry expertise.
By undertaking rigorous analysis, managers may uncover hidden competitive advantages—and generate higher potential returns in the process.


Economy
Economic Growth Forecasts for G7 and BRICS Countries in 2024
The IMF has released its economic growth forecasts for 2024. How do the G7 and BRICS countries compare?


G7 & BRICS Real GDP Growth Forecasts for 2024
The International Monetary Fund’s (IMF) has released its real gross domestic product (GDP) growth forecasts for 2024, and while global growth is projected to stay steady at 3.2%, various major nations are seeing declining forecasts.
This chart visualizes the 2024 real GDP growth forecasts using data from the IMF’s 2024 World Economic Outlook for G7 and BRICS member nations along with Saudi Arabia, which is still considering an invitation to join the bloc.
Get the Key Insights of the IMF’s World Economic Outlook
Want a visual breakdown of the insights from the IMF’s 2024 World Economic Outlook report?
This visual is part of a special dispatch of the key takeaways exclusively for VC+ members.
Get the full dispatch of charts by signing up to VC+.
Mixed Economic Growth Prospects for Major Nations in 2024
Economic growth projections by the IMF for major nations are mixed, with the majority of G7 and BRICS countries forecasted to have slower growth in 2024 compared to 2023.
Only three BRICS-invited or member countries, Saudi Arabia, the UAE, and South Africa, have higher projected real GDP growth rates in 2024 than last year.
| Group | Country | Real GDP Growth (2023) | Real GDP Growth (2024P) |
|---|---|---|---|
| G7 | 🇺🇸 U.S. | 2.5% | 2.7% |
| G7 | 🇨🇦 Canada | 1.1% | 1.2% |
| G7 | 🇯🇵 Japan | 1.9% | 0.9% |
| G7 | 🇫🇷 France | 0.9% | 0.7% |
| G7 | 🇮🇹 Italy | 0.9% | 0.7% |
| G7 | 🇬🇧 UK | 0.1% | 0.5% |
| G7 | 🇩🇪 Germany | -0.3% | 0.2% |
| BRICS | 🇮🇳 India | 7.8% | 6.8% |
| BRICS | 🇨🇳 China | 5.2% | 4.6% |
| BRICS | 🇦🇪 UAE | 3.4% | 3.5% |
| BRICS | 🇮🇷 Iran | 4.7% | 3.3% |
| BRICS | 🇷🇺 Russia | 3.6% | 3.2% |
| BRICS | 🇪🇬 Egypt | 3.8% | 3.0% |
| BRICS-invited | 🇸🇦 Saudi Arabia | -0.8% | 2.6% |
| BRICS | 🇧🇷 Brazil | 2.9% | 2.2% |
| BRICS | 🇿🇦 South Africa | 0.6% | 0.9% |
| BRICS | 🇪🇹 Ethiopia | 7.2% | 6.2% |
| 🌍 World | 3.2% | 3.2% |
China and India are forecasted to maintain relatively high growth rates in 2024 at 4.6% and 6.8% respectively, but compared to the previous year, China is growing 0.6 percentage points slower while India is an entire percentage point slower.
On the other hand, four G7 nations are set to grow faster than last year, which includes Germany making its comeback from its negative real GDP growth of -0.3% in 2023.
Faster Growth for BRICS than G7 Nations
Despite mostly lower growth forecasts in 2024 compared to 2023, BRICS nations still have a significantly higher average growth forecast at 3.6% compared to the G7 average of 1%.
While the G7 countries’ combined GDP is around $15 trillion greater than the BRICS nations, with continued higher growth rates and the potential to add more members, BRICS looks likely to overtake the G7 in economic size within two decades.
BRICS Expansion Stutters Before October 2024 Summit
BRICS’ recent expansion has stuttered slightly, as Argentina’s newly-elected president Javier Milei declined its invitation and Saudi Arabia clarified that the country is still considering its invitation and has not joined BRICS yet.
Even with these initial growing pains, South Africa’s Foreign Minister Naledi Pandor told reporters in February that 34 different countries have submitted applications to join the growing BRICS bloc.
Any changes to the group are likely to be announced leading up to or at the 2024 BRICS summit which takes place October 22-24 in Kazan, Russia.
Get the Full Analysis of the IMF’s Outlook on VC+
This visual is part of an exclusive special dispatch for VC+ members which breaks down the key takeaways from the IMF’s 2024 World Economic Outlook.
For the full set of charts and analysis, sign up for VC+.

-

 Markets1 week ago
U.S. Debt Interest Payments Reach $1 Trillion
-

 Business2 weeks ago
Charted: Big Four Market Share by S&P 500 Audits
-

 Real Estate2 weeks ago
Ranked: The Most Valuable Housing Markets in America
-

 Money2 weeks ago
Which States Have the Highest Minimum Wage in America?
-

 AI2 weeks ago
Ranked: Semiconductor Companies by Industry Revenue Share
-

 Markets2 weeks ago
Ranked: The World’s Top Flight Routes, by Revenue
-

 Demographics2 weeks ago
Population Projections: The World’s 6 Largest Countries in 2075
-

 Markets2 weeks ago
The Top 10 States by Real GDP Growth in 2023