Markets
Infographic: What is a Mutual Fund?

What is a Mutual Fund?
The birth of the mutual fund goes all the way back to 1774, when Dutch merchant Adriaan van Ketwich first pooled the resources from a number of small investors to form a trust.
This was during a time of extreme uncertainty in the markets, and the world’s first mutual fund allowed this pool of investors to diversify across a number of European countries and American colonies. Like most other early mutual funds, it was a closed-end fund – meaning that after the first 2,000 units were purchased, participation could only occur from buying or selling shares on the secondary market.
This first fund, called “Eendragt Maakt Magt” (“unity creates strength”), lasted for 50 years and set the stage for what is now a $40.4 trillion industry globally.
The Modern Mutual Fund
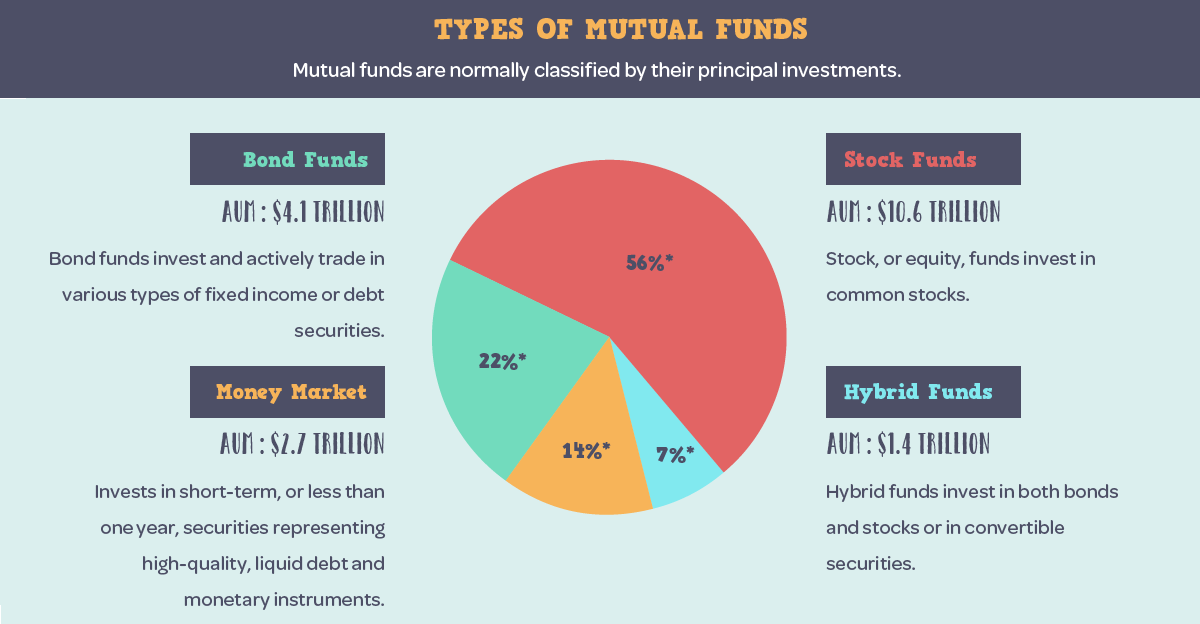
Today’s infographic comes to us from StocksToTrade and it showcases the basics around mutual funds, including their history, typical structures, why people invest in them, and how fees usually break down.
A mutual fund is defined as an investment vehicle made up of a pool of money collected from many investors. A professional manager for the fund invests this capital in stocks, bonds, commodities, real estate, and other assets based on the objectives stated in the fund’s prospectus.
Unlike the very first mutual fund created in the 18th century, the most common funds today are open-ended. These funds buy back or sell their shares at the end of each day based on the net asset value (NAV) of securities, and open-end funds accounted for $16.3 trillion of assets under management (AUM) in the U.S. at the end of 2016.
| Type of Mutual Fund | Number of Funds | AUM (U.S.) | % of U.S. Industry |
|---|---|---|---|
| Open-end funds | 8,066 | $16.3 trillion | 86.0% |
| Closed-end funds | 530 | $0.3 trillion | 1.0% |
| Unit investment trusts | 5,103 | $0.1 trillion | 0.3% |
Closed-end funds and unit investment trusts (UITs) make up the rest of the mutual fund market, and of course the fast-growing ETF sector makes up a growing piece of the wider U.S. fund industry as well.
Why Do People Invest?
As the world’s investment industry grew and matured in the 20th century, a few different factors led to people investing more in mutual funds.
Over time, investors realized they wanted easy access to diverse portfolios, daily liquidity, as well as the world’s top portfolio managers – and mutual funds can offer all of these advantages to the average investor.
Here are the basic guidelines for choosing a mutual fund:
- Use a mutual fund cost calculator to compare how fees from various funds will impact returns
- Evaluate portfolio managers based on their results over time
- Comparing fund returns across a number of metrics can be important. Look at historical results, benchmark comparisons, and other funds in the peer group
- Use online services like MorningStar to do thorough research before investing
- Look at how well a fund is positioned for future successes
- Read the fund’s prospectus and shareholder reports for further information
Want to learn more on different types of assets and investments?
See infographics on hedge funds, ETFs, dividend stocks, or even microcap stocks.


Markets
U.S. Debt Interest Payments Reach $1 Trillion
U.S. debt interest payments have surged past the $1 trillion dollar mark, amid high interest rates and an ever-expanding debt burden.


U.S. Debt Interest Payments Reach $1 Trillion
This was originally posted on our Voronoi app. Download the app for free on iOS or Android and discover incredible data-driven charts from a variety of trusted sources.
The cost of paying for America’s national debt crossed the $1 trillion dollar mark in 2023, driven by high interest rates and a record $34 trillion mountain of debt.
Over the last decade, U.S. debt interest payments have more than doubled amid vast government spending during the pandemic crisis. As debt payments continue to soar, the Congressional Budget Office (CBO) reported that debt servicing costs surpassed defense spending for the first time ever this year.
This graphic shows the sharp rise in U.S. debt payments, based on data from the Federal Reserve.
A $1 Trillion Interest Bill, and Growing
Below, we show how U.S. debt interest payments have risen at a faster pace than at another time in modern history:
| Date | Interest Payments | U.S. National Debt |
|---|---|---|
| 2023 | $1.0T | $34.0T |
| 2022 | $830B | $31.4T |
| 2021 | $612B | $29.6T |
| 2020 | $518B | $27.7T |
| 2019 | $564B | $23.2T |
| 2018 | $571B | $22.0T |
| 2017 | $493B | $20.5T |
| 2016 | $460B | $20.0T |
| 2015 | $435B | $18.9T |
| 2014 | $442B | $18.1T |
| 2013 | $425B | $17.2T |
| 2012 | $417B | $16.4T |
| 2011 | $433B | $15.2T |
| 2010 | $400B | $14.0T |
| 2009 | $354B | $12.3T |
| 2008 | $380B | $10.7T |
| 2007 | $414B | $9.2T |
| 2006 | $387B | $8.7T |
| 2005 | $355B | $8.2T |
| 2004 | $318B | $7.6T |
| 2003 | $294B | $7.0T |
| 2002 | $298B | $6.4T |
| 2001 | $318B | $5.9T |
| 2000 | $353B | $5.7T |
| 1999 | $353B | $5.8T |
| 1998 | $360B | $5.6T |
| 1997 | $368B | $5.5T |
| 1996 | $362B | $5.3T |
| 1995 | $357B | $5.0T |
| 1994 | $334B | $4.8T |
| 1993 | $311B | $4.5T |
| 1992 | $306B | $4.2T |
| 1991 | $308B | $3.8T |
| 1990 | $298B | $3.4T |
| 1989 | $275B | $3.0T |
| 1988 | $254B | $2.7T |
| 1987 | $240B | $2.4T |
| 1986 | $225B | $2.2T |
| 1985 | $219B | $1.9T |
| 1984 | $205B | $1.7T |
| 1983 | $176B | $1.4T |
| 1982 | $157B | $1.2T |
| 1981 | $142B | $1.0T |
| 1980 | $113B | $930.2B |
| 1979 | $96B | $845.1B |
| 1978 | $84B | $789.2B |
| 1977 | $69B | $718.9B |
| 1976 | $61B | $653.5B |
| 1975 | $55B | $576.6B |
| 1974 | $50B | $492.7B |
| 1973 | $45B | $469.1B |
| 1972 | $39B | $448.5B |
| 1971 | $36B | $424.1B |
| 1970 | $35B | $389.2B |
| 1969 | $30B | $368.2B |
| 1968 | $25B | $358.0B |
| 1967 | $23B | $344.7B |
| 1966 | $21B | $329.3B |
Interest payments represent seasonally adjusted annual rate at the end of Q4.
At current rates, the U.S. national debt is growing by a remarkable $1 trillion about every 100 days, equal to roughly $3.6 trillion per year.
As the national debt has ballooned, debt payments even exceeded Medicaid outlays in 2023—one of the government’s largest expenditures. On average, the U.S. spent more than $2 billion per day on interest costs last year. Going further, the U.S. government is projected to spend a historic $12.4 trillion on interest payments over the next decade, averaging about $37,100 per American.
Exacerbating matters is that the U.S. is running a steep deficit, which stood at $1.1 trillion for the first six months of fiscal 2024. This has accelerated due to the 43% increase in debt servicing costs along with a $31 billion dollar increase in defense spending from a year earlier. Additionally, a $30 billion increase in funding for the Federal Deposit Insurance Corporation in light of the regional banking crisis last year was a major contributor to the deficit increase.
Overall, the CBO forecasts that roughly 75% of the federal deficit’s increase will be due to interest costs by 2034.

-

 Technology2 weeks ago
Ranked: The Most Popular Smartphone Brands in the U.S.
-

 Automotive1 week ago
Almost Every EV Stock is Down After Q1 2024
-

 Money1 week ago
Where Does One U.S. Tax Dollar Go?
-

 Green2 weeks ago
Ranked: Top Countries by Total Forest Loss Since 2001
-

 Real Estate2 weeks ago
Visualizing America’s Shortage of Affordable Homes
-

 Maps2 weeks ago
Mapped: Average Wages Across Europe
-

 Mining2 weeks ago
Charted: The Value Gap Between the Gold Price and Gold Miners
-

 Demographics2 weeks ago
Visualizing the Size of the Global Senior Population