Business
Impact of Tourism by Country and State
Impact of Tourism by Country and State
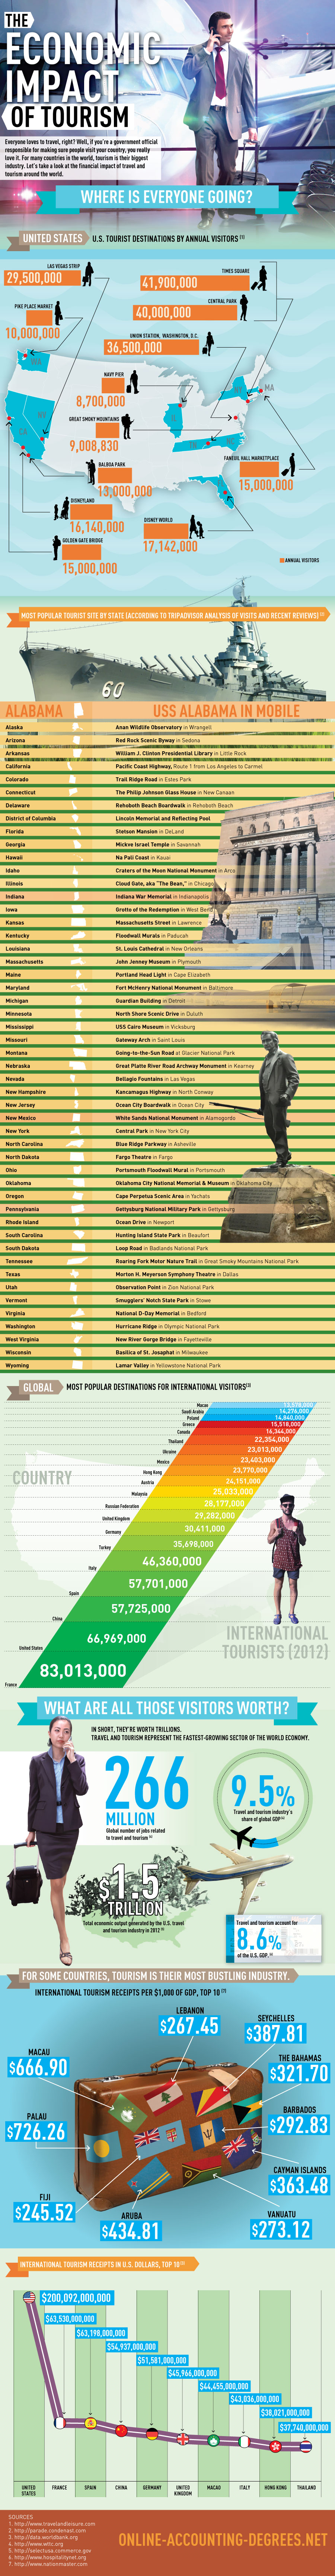
Over the last 30 years, the price of airfare has fallen over 50%. It goes to show, since airlines have lost money every other year since 1981. The industry bled $51 billion in the 10 year span between 2001 and 2011 as more competition entered the space.
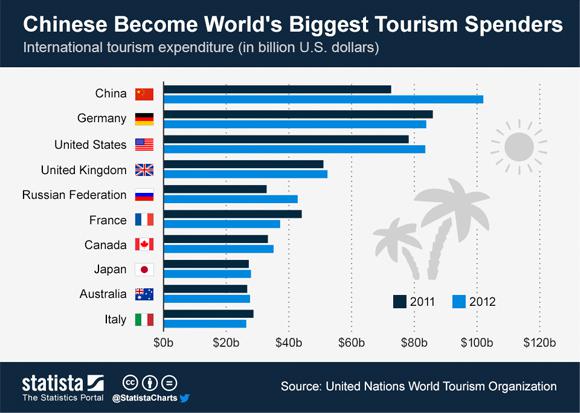
However, this is a boon for consumers and for the regions getting attention from international tourists. In terms of sheer volume, the travel industry has never been as good. The global share of GDP for the travel industry is now 9.5%. In 2012, it is also worth noting that China overtook every other country in travel spending abroad with a hefty $102 billion of expenditures.
While it is not the easiest thing to play from an investment perspective, it is a continuing trend that arches above everything else. There are also some interesting Chinese companies to consider such as Ctrip.com (NASDAQ: CTRP) which essentially aggregates hotel and flight deals in China.
Original graphic from: Online Accounting Degrees
Markets
Ranked: The Largest U.S. Corporations by Number of Employees
We visualized the top U.S. companies by employees, revealing the massive scale of retailers like Walmart, Target, and Home Depot.


The Largest U.S. Corporations by Number of Employees
This was originally posted on our Voronoi app. Download the app for free on Apple or Android and discover incredible data-driven charts from a variety of trusted sources.
Revenue and profit are common measures for measuring the size of a business, but what about employee headcount?
To see how big companies have become from a human perspective, we’ve visualized the top U.S. companies by employees. These figures come from companiesmarketcap.com, and were accessed in March 2024. Note that this ranking includes publicly-traded companies only.
Data and Highlights
The data we used to create this list of largest U.S. corporations by number of employees can be found in the table below.
| Company | Sector | Number of Employees |
|---|---|---|
| Walmart | Consumer Staples | 2,100,000 |
| Amazon | Consumer Discretionary | 1,500,000 |
| UPS | Industrials | 500,000 |
| Home Depot | Consumer Discretionary | 470,000 |
| Concentrix | Information Technology | 440,000 |
| Target | Consumer Staples | 440,000 |
| Kroger | Consumer Staples | 430,000 |
| UnitedHealth | Health Care | 400,000 |
| Berkshire Hathaway | Financials | 383,000 |
| Starbucks | Consumer Discretionary | 381,000 |
| Marriott International | Consumer Discretionary | 377,000 |
| Cognizant | Information Technology | 346,600 |
Retail and Logistics Top the List
Companies like Walmart, Target, and Kroger have a massive headcount due to having many locations spread across the country, which require everything from cashiers to IT professionals.
Moving goods around the world is also highly labor intensive, explaining why UPS has half a million employees globally.
Below the Radar?
Two companies that rank among the largest U.S. corporations by employees which may be less familiar to the public include Concentrix and Cognizant. Both of these companies are B2B brands, meaning they primarily work with other companies rather than consumers. This contrasts with brands like Amazon or Home Depot, which are much more visible among average consumers.
A Note on Berkshire Hathaway
Warren Buffett’s company doesn’t directly employ 383,000 people. This headcount actually includes the employees of the firm’s many subsidiaries, such as GEICO (insurance), Dairy Queen (retail), and Duracell (batteries).
If you’re curious to see how Buffett’s empire has grown over the years, check out this animated graphic that visualizes the growth of Berkshire Hathaway’s portfolio from 1994 to 2022.

-

 Real Estate2 weeks ago
Visualizing America’s Shortage of Affordable Homes
-

 Technology1 week ago
Ranked: Semiconductor Companies by Industry Revenue Share
-

 Money2 weeks ago
Which States Have the Highest Minimum Wage in America?
-

 Real Estate2 weeks ago
Ranked: The Most Valuable Housing Markets in America
-

 Business2 weeks ago
Charted: Big Four Market Share by S&P 500 Audits
-

 AI2 weeks ago
The Stock Performance of U.S. Chipmakers So Far in 2024
-

 Misc2 weeks ago
Almost Every EV Stock is Down After Q1 2024
-

 Money2 weeks ago
Where Does One U.S. Tax Dollar Go?