Misc
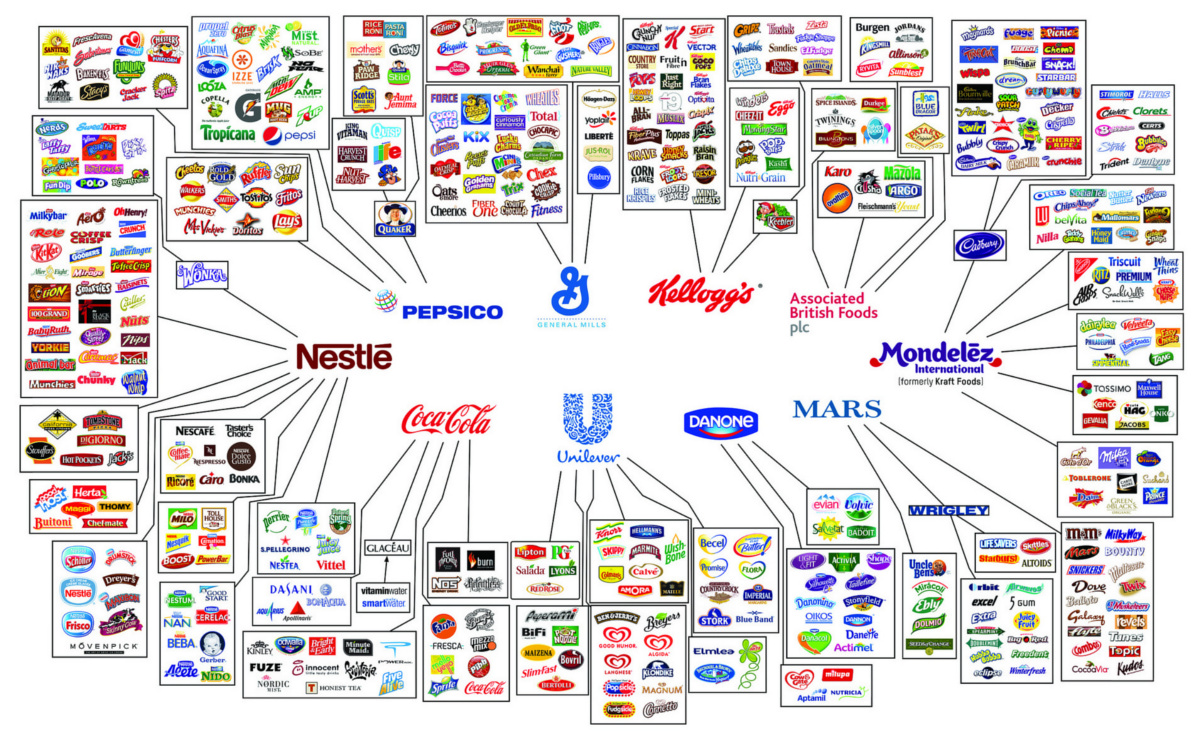
The Illusion of Choice in Consumer Brands
The Illusion of Choice in Consumer Brands
Explore the full-size version of the above graphic in all its glory.
If today’s infographic looks familiar, that’s because it originates from a well-circulated report that Oxfam International puts together to show consolidation in the mass consumer goods industry.
We are sharing it because we believe it is important for you to be aware of who is supplying the different brands and goods served on your dinner table.
Unlikely Links
The illusion of choice does not arise from the products we expect the companies to sell. We inherently know that PepsiCo sells plenty of beverages, including its flagship product. We know that Nestlé makes Kit Kat, Nesquick chocolate syrup, Nespresso coffee machines, and Nescafé instant coffee.
What is less obvious is that Nestlé makes Gerber baby food, Hot Pockets, DiGiorno pizzas, and Stouffer brand frozen foods. Nestlé even owns two competing brands of fancy, carbonated water: San Pellegrino and Perrier.
In fact, Nestlé has at least 29 brands with annual sales over $1 billion. The company literally has hundreds of different products in sectors ranging from pet food to soups and sauces. It’s the world’s largest food company by revenues, and it’s worth a whopping $240 billion in market capitalization.
They Might Be Giants
It’s not just Nestlé that is mind-boggling in size and scope.
Other companies such as Coca-Cola, Kellogg’s, Mondelēz, PepsiCo, General Mills, Danone, and Mars are also massive. They each own dozens of brands that dominate certain product categories.
Want to buy crackers? Pick up some Ritz, Triscuits, Wheat Thins, Air Crisps, or Premium brand crackers – but know they are all owned by Mondelēz (formerly Kraft Foods).
Buying a chocolate bar? There are seemingly hundreds to choose from, but its just the illusion of choice. They pretty much all come from Mars, Nestlé, or Mondelēz (which owns Cadbury).
There’s nothing wrong in buying from these brands, but remember that each dollar of your money is a vote. Vote for products and companies you believe in!
Note: the above graphic is about 1.5 years old, and it misses recent acquisitions or changes in brand ownership. For example, Power Bar is now owned by Post Holdings, another giant consumer foods conglomerate. That said, we believes the point of the graphic still comes across.


Misc
How Hard Is It to Get Into an Ivy League School?
We detail the admission rates and average annual cost for Ivy League schools, as well as the median SAT scores required to be accepted.


How Hard Is It to Get Into an Ivy League School?
This was originally posted on our Voronoi app. Download the app for free on iOS or Android and discover incredible data-driven charts from a variety of trusted sources.
Ivy League institutions are renowned worldwide for their academic excellence and long-standing traditions. But how hard is it to get into one of the top universities in the U.S.?
In this graphic, we detail the admission rates and average annual cost for Ivy League schools, as well as the median SAT scores required to be accepted. The data comes from the National Center for Education Statistics and was compiled by 24/7 Wall St.
Note that “average annual cost” represents the net price a student pays after subtracting the average value of grants and/or scholarships received.
Harvard is the Most Selective
The SAT is a standardized test commonly used for college admissions in the United States. It’s taken by high school juniors and seniors to assess their readiness for college-level academic work.
When comparing SAT scores, Harvard and Dartmouth are among the most challenging universities to gain admission to. The median SAT scores for their students are 760 for reading and writing and 790 for math. Still, Harvard has half the admission rate (3.2%) compared to Dartmouth (6.4%).
| School | Admission rate (%) | SAT Score: Reading & Writing | SAT Score: Math | Avg Annual Cost* |
|---|---|---|---|---|
| Harvard University | 3.2 | 760 | 790 | $13,259 |
| Columbia University | 3.9 | 750 | 780 | $12,836 |
| Yale University | 4.6 | 760 | 780 | $16,341 |
| Brown University | 5.1 | 760 | 780 | $26,308 |
| Princeton University | 5.7 | 760 | 780 | $11,080 |
| Dartmouth College | 6.4 | 760 | 790 | $33,023 |
| University of Pennsylvania | 6.5 | 750 | 790 | $14,851 |
| Cornell University | 7.5 | 750 | 780 | $29,011 |
*Costs after receiving federal financial aid.
Additionally, Dartmouth has the highest average annual cost at $33,000. Princeton has the lowest at $11,100.
While student debt has surged in the United States in recent years, hitting $1.73 trillion in 2023, the worth of obtaining a degree from any of the schools listed surpasses mere academics. This is evidenced by the substantial incomes earned by former students.
Harvard grads, for example, have the highest average starting salary in the country, at $91,700.

-

 Real Estate2 weeks ago
Visualizing America’s Shortage of Affordable Homes
-

 Technology1 week ago
Ranked: Semiconductor Companies by Industry Revenue Share
-

 Money1 week ago
Which States Have the Highest Minimum Wage in America?
-

 Real Estate1 week ago
Ranked: The Most Valuable Housing Markets in America
-

 Business2 weeks ago
Charted: Big Four Market Share by S&P 500 Audits
-

 AI2 weeks ago
The Stock Performance of U.S. Chipmakers So Far in 2024
-

 Misc2 weeks ago
Almost Every EV Stock is Down After Q1 2024
-

 Money2 weeks ago
Where Does One U.S. Tax Dollar Go?