Green
The Human Impact on the World’s Forests
View a high resolution version of this graphic.
Source: Global forest Watch
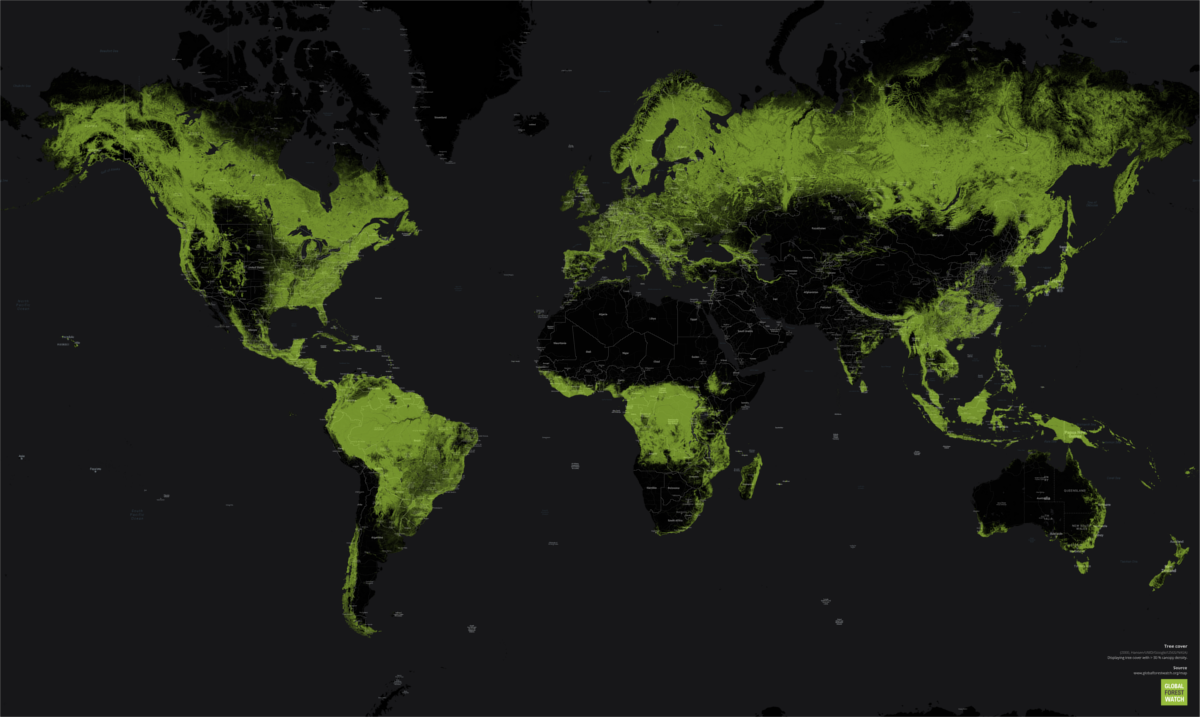
Snapshot of the World’s Forests
View the high resolution version of today’s graphic by clicking here.
Forests cover over 30% of the world’s land, but human activity is chipping away at the tree line.
At the outset of the 20th century, there was approximately 31 million square miles (50 million square km) of forest around the world. Today, that number has shrunk to less than 25 million square miles (40 million square km). Much of this decline can be attributed to expanding agricultural land use and increasing demand for wood and paper products.
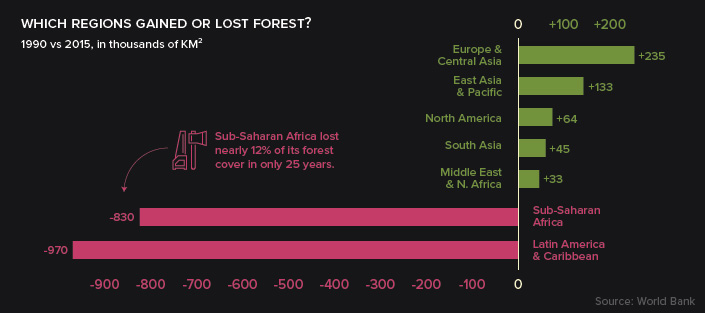
Source: World Bank
The growth and decline of forest cover is hardly uniform. Deserts, farmland, and urban areas ebb and flow around the world, and while some countries are rapidly removing trees from their ecosystem, others are seeing increases in their forest cover.
Receding Leaf Line
Since 1990, global forested area has shrunk by 2 million square miles (3.1 million square km), with many of those losses occurring in South America and Sub-Saharan Africa.
The Amazon Rainforest, one of the most important carbon sinks on the planet, has faced intense pressure from human activity over the last few decades. Brazil’s expanding network of roads has been critical for economic development, but the landscape often pays the price as the country increases its GDP per capita.
Rainforest turns to farmland in Brazil’s Rondônia state: 1984–2016
Across the Atlantic Ocean, Africa is grappling with deforestation.
West Africa, for example, has lost a shocking 90% of its forest cover over the last century – in a number of countries, all of the forest outside of protected areas has been logged, while illegal logging threatens parks and reserves.
If nothing is done, we may lose everything.
– Abraham Baffoe, Africa regional director at Proforest
Forest Renewal
Images of slash-and-burn land clearing and denuded hillsides grab the headlines, however, there are a few places in the world where forests are expanding.
Europe, in particular, has seen widespread regeneration of forests over the past century.
Source: Wageningen
China is another, perhaps surprising, place where there have been big increases in forested areas.
Each year, dust storms blowing in from the expanding Gobi Desert displace as much as 800 square miles (2,000 square km) of topsoil and damage crops adjacent to the expanding desert. In response, the government created the Three-North Shelterbelt Program, which they hope will halt desertification. Thousands of miles of newly-planted vegetation will act like a wall, containing the spread of the Gobi Desert.
The Big Picture
Activities that lead to deforestation differ from region to region, but they’re always economic in nature. Palm oil, logging, raising cattle, and even charcoal production are all ways people can pull themselves out of poverty in developing countries.
The good news is that as per capita incomes in developing countries continue to rise, pressure on forests should lessen.
This theory is best visualized by Kuznets Curve, which demonstrates a link between economic development and environmental degradation.
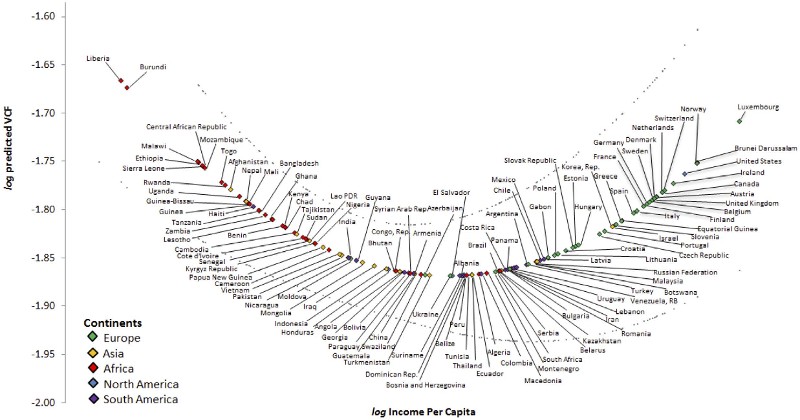
Click here to view the full sized version.
In regions with lax enforcement, corruption, and a large population of people living below the poverty line, deforestation could remain a problem until economic conditions improve. Thankfully, the five countries with the most forest cover – Russia, Brazil, Canada, U.S., and China – are on or are moving towards a more favorable side of the curve.
Another bright spot in this story is that governments are increasingly protecting habitat in the form of nature reserves and national parks. Since 1990, the amount of nationally protected land in the world has nearly doubled.


Green
How Carbon Credits Can Help Close the Climate Funding Gap
To keep a 1.5℃ world within reach, global emissions need to fall by as much as 45% by 2030, and carbon credits could help close the gap.


How Carbon Credits Can Help Close the Climate Funding Gap
Governments around the world have committed to the goals of the Paris Agreement, but their climate pledges are insufficient. To keep a 1.5℃ world within reach, global emissions need to fall by as much as 45% by 2030.
Bold and immediate action is essential, but so are resources that will make it happen.
In this graphic, we have partnered with Carbon Streaming to look at the role that the voluntary carbon market and carbon credits can play in closing that gap.
More Funds are Needed for Climate Finance
According to data from the Climate Policy Initiative, climate finance, which includes funds for both adaptation and mitigation, needs to increase at least five-fold, from $1.3T in 2021/2022, to an average $8.6T annually until 2030, and then to just over $10T in the two decades leading up to 2050.
That adds up to a very large number, but consider that in 2022, $7.0T went to fossil fuel subsidies, which almost covers the annual estimated outlay. And the world has shown that when pressed, governments can come up with the money, if the global pandemic is any indication.
Mobilizing Carbon Finance to the Developing World
But the same cannot be said of the developing world, where debt, inequality, and poverty reduce the ability of governments to act. And this is where carbon credits can play an important role. According to analyses from Ecosystem Marketplace, carbon credits help move capital from developed countries, to where funds are needed in the developing world.
For example, in 2019, 69.2% of the carbon credits by volume in the voluntary carbon market were purchased by buyers in Europe, and nearly a third from North America. Compare that to over 90% of the volume of carbon credits sold in the voluntary carbon market in 2022 came from projects that were located outside of those two regions.
Carbon Credits Can Complement Decarbonization Efforts
Carbon credits can also complement decarbonization efforts in the corporate world, where more and more companies have been signing up to reduce emissions. According to the 2022 monitoring report from the Science Based Targets initiative, 4,230 companies around the world had approved targets and commitments, which represented an 88% increase from the prior year. However, as of year end 2022, combined scope 1 and 2 emissions covered by science-based targets totaled approximately 2 GtCO2e, which represents just a fraction of global emissions.
The fine print is that this is just scope 1 and 2 emissions, and doesn’t include scope 3 emissions, which can account for more than 70% of a company’s total emissions. And as these emissions come under greater and greater scrutiny the closer we get to 2030 and beyond, the voluntary carbon credit market could expand exponentially to help meet the need to compensate for these emissions.
Potential Carbon Credit Market Size in 2030
OK, but how big? In 2022, the voluntary carbon credit market was around $2B, but some analysts predict that it could grow to between $5–250 billion by 2030.
| Firm | Low Estimate | High Estimate |
|---|---|---|
| Bain & Company | $15B | $30B |
| Barclays | N/A | $250B |
| Citigroup | $5B | $50B |
| McKinsey & Company | $5B | $50B |
| Morgan Stanley | N/A | $100B |
| Shell / Boston Consulting Group | $10B | $40B |
Morgan Stanley and Barclays were the most bullish on the size of the voluntary carbon credit market in 2030, but the latter firm was even more optimistic about 2050, and predicted that the voluntary carbon credit market could grow to a colossal $1.5 trillion.
Carbon Streaming is Focused on Carbon Credit Integrity
Ultimately, carbon credits could have an important role to play in marshaling the resources needed to keep the world on track to net zero by 2050, and avoiding the worst consequences of a warming world.
Carbon Streaming uses streaming transactions, a proven and flexible funding model, to scale high-integrity carbon credit projects to advance global climate action and UN Sustainable Development Goals.
Learn more at www.carbonstreaming.com.

-

 Green1 week ago
Ranking the Top 15 Countries by Carbon Tax Revenue
This graphic highlights France and Canada as the global leaders when it comes to generating carbon tax revenue.
-

 Green1 week ago
Ranked: The Countries With the Most Air Pollution in 2023
South Asian nations are the global hotspot for pollution. In this graphic, we rank the world’s most polluted countries according to IQAir.
-

 Environment2 weeks ago
Top Countries By Forest Growth Since 2001
One country is taking reforestation very seriously, registering more than 400,000 square km of forest growth in two decades.
-

 Green3 weeks ago
Ranked: Top Countries by Total Forest Loss Since 2001
The country with the most forest loss since 2001 lost as much forest cover as the next four countries combined.
-

 Markets2 months ago
The World’s Top Cocoa Producing Countries
Here are the largest cocoa producing countries globally—from Côte d’Ivoire to Brazil—as cocoa prices hit record highs.
-

 Environment2 months ago
Charted: Share of World Forests by Country
We visualize which countries have the biggest share of world forests by area—and while country size plays a factor, so too, does the environment.

-

 Markets1 week ago
U.S. Debt Interest Payments Reach $1 Trillion
-

 Markets2 weeks ago
Ranked: The Most Valuable Housing Markets in America
-

 Money2 weeks ago
Which States Have the Highest Minimum Wage in America?
-

 AI2 weeks ago
Ranked: Semiconductor Companies by Industry Revenue Share
-

 Markets2 weeks ago
Ranked: The World’s Top Flight Routes, by Revenue
-

 Countries2 weeks ago
Population Projections: The World’s 6 Largest Countries in 2075
-

 Markets2 weeks ago
The Top 10 States by Real GDP Growth in 2023
-

 Money2 weeks ago
The Smallest Gender Wage Gaps in OECD Countries