Markets
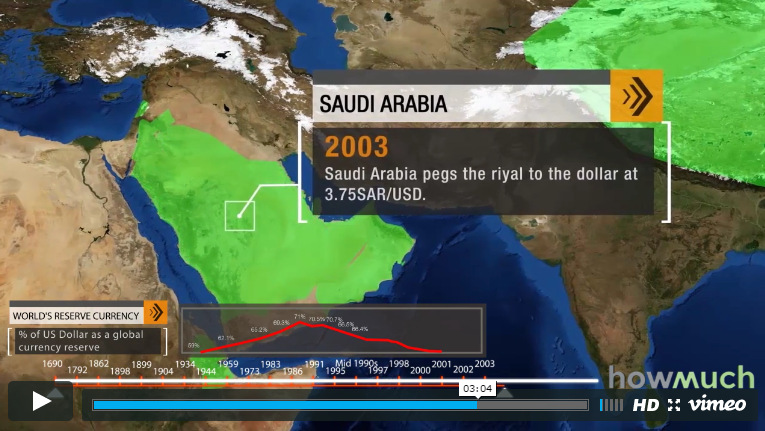
Video: How the U.S. Dollar Spread Across the World
Video: How the U.S. Dollar Spread Across the World
The U.S. dollar is the world’s dominant reserve currency, making up about 64% of all official foreign exchange reserves.
The euro is second on the list. The euro had shown decent promise as a reserve currency up until 2009, when it peaked at 28% of global reserves. However, between the European Debt Crisis and years of anemic growth in major European countries, the currency has declined to 20% of official global reserves today.
Other currencies held as foreign reserves include British pounds (5%), Japanese yen (4%), Canadian dollars (2%), and Australian dollars (2%). Swiss francs and other currencies make up the remaining 3%.
The Chinese yuan also recently won IMF approval to make up part of its Special Drawing Rights (SDR) basket. More and more trade is in Chinese currency, and the country’s bond markets are beginning to grow and internationalize.
The yuan is not a significant player yet, but in the future it may be.
The Rise of the Dollar
History has shown that every 100 years or so, the world’s de facto reserve currency has been replaced.
The last time this happened was after World War II, when the Bretton Woods system came into effect. Under this system, the U.S. dollar was established as the global anchor currency, linked to gold at a fixed rate. The combination of post-war growth in the U.S. economy along with the official link between dollars and gold provided the international monetary system with a degree of certainty that had been missing for decades.
In 1971, Nixon severed the link between the U.S. dollar and gold, but continued U.S. economic and financial strength would keep the dollar prominent on the international monetary stage for decades to come.
What Does the Future Hold?
The video in this post, created by the team at HowMuch.net shows the evolution in acceptance of the greenback. At first, it was U.S. overseas territories such as Guam and the U.S. Virgin Islands that would adopt the dollar. Later in the 20th century, major nations from China to Argentina would attempt to peg their currencies to the dollar for much-needed stability.
Will this dollar hegemony continue well into the future?
As HowMuch.net notes in its post, it is the size, stability, and liquidity of the country’s financial markets that are the major underlying factors to determine the strength of a reserve currency.
While China is now the largest economy in the world in terms of purchasing power, the financial markets of the United States still reign supreme. For example, U.S. stock markets still make up 52% of the total market capitalization of global equity markets. China’s markets are puny in comparison at around 2%.
There are signs of a shift in momentum, however.
U.S. Treasuries have less liquidity and China has been dumping them on the market. The yuan is officially part of the SDR basket in October 2016, and China could see an inflow of up to $3 trillion in renminbi assets as a result. The yuan has also now passed the yen in terms of cross-border trade volume.


Markets
U.S. Debt Interest Payments Reach $1 Trillion
U.S. debt interest payments have surged past the $1 trillion dollar mark, amid high interest rates and an ever-expanding debt burden.


U.S. Debt Interest Payments Reach $1 Trillion
This was originally posted on our Voronoi app. Download the app for free on iOS or Android and discover incredible data-driven charts from a variety of trusted sources.
The cost of paying for America’s national debt crossed the $1 trillion dollar mark in 2023, driven by high interest rates and a record $34 trillion mountain of debt.
Over the last decade, U.S. debt interest payments have more than doubled amid vast government spending during the pandemic crisis. As debt payments continue to soar, the Congressional Budget Office (CBO) reported that debt servicing costs surpassed defense spending for the first time ever this year.
This graphic shows the sharp rise in U.S. debt payments, based on data from the Federal Reserve.
A $1 Trillion Interest Bill, and Growing
Below, we show how U.S. debt interest payments have risen at a faster pace than at another time in modern history:
| Date | Interest Payments | U.S. National Debt |
|---|---|---|
| 2023 | $1.0T | $34.0T |
| 2022 | $830B | $31.4T |
| 2021 | $612B | $29.6T |
| 2020 | $518B | $27.7T |
| 2019 | $564B | $23.2T |
| 2018 | $571B | $22.0T |
| 2017 | $493B | $20.5T |
| 2016 | $460B | $20.0T |
| 2015 | $435B | $18.9T |
| 2014 | $442B | $18.1T |
| 2013 | $425B | $17.2T |
| 2012 | $417B | $16.4T |
| 2011 | $433B | $15.2T |
| 2010 | $400B | $14.0T |
| 2009 | $354B | $12.3T |
| 2008 | $380B | $10.7T |
| 2007 | $414B | $9.2T |
| 2006 | $387B | $8.7T |
| 2005 | $355B | $8.2T |
| 2004 | $318B | $7.6T |
| 2003 | $294B | $7.0T |
| 2002 | $298B | $6.4T |
| 2001 | $318B | $5.9T |
| 2000 | $353B | $5.7T |
| 1999 | $353B | $5.8T |
| 1998 | $360B | $5.6T |
| 1997 | $368B | $5.5T |
| 1996 | $362B | $5.3T |
| 1995 | $357B | $5.0T |
| 1994 | $334B | $4.8T |
| 1993 | $311B | $4.5T |
| 1992 | $306B | $4.2T |
| 1991 | $308B | $3.8T |
| 1990 | $298B | $3.4T |
| 1989 | $275B | $3.0T |
| 1988 | $254B | $2.7T |
| 1987 | $240B | $2.4T |
| 1986 | $225B | $2.2T |
| 1985 | $219B | $1.9T |
| 1984 | $205B | $1.7T |
| 1983 | $176B | $1.4T |
| 1982 | $157B | $1.2T |
| 1981 | $142B | $1.0T |
| 1980 | $113B | $930.2B |
| 1979 | $96B | $845.1B |
| 1978 | $84B | $789.2B |
| 1977 | $69B | $718.9B |
| 1976 | $61B | $653.5B |
| 1975 | $55B | $576.6B |
| 1974 | $50B | $492.7B |
| 1973 | $45B | $469.1B |
| 1972 | $39B | $448.5B |
| 1971 | $36B | $424.1B |
| 1970 | $35B | $389.2B |
| 1969 | $30B | $368.2B |
| 1968 | $25B | $358.0B |
| 1967 | $23B | $344.7B |
| 1966 | $21B | $329.3B |
Interest payments represent seasonally adjusted annual rate at the end of Q4.
At current rates, the U.S. national debt is growing by a remarkable $1 trillion about every 100 days, equal to roughly $3.6 trillion per year.
As the national debt has ballooned, debt payments even exceeded Medicaid outlays in 2023—one of the government’s largest expenditures. On average, the U.S. spent more than $2 billion per day on interest costs last year. Going further, the U.S. government is projected to spend a historic $12.4 trillion on interest payments over the next decade, averaging about $37,100 per American.
Exacerbating matters is that the U.S. is running a steep deficit, which stood at $1.1 trillion for the first six months of fiscal 2024. This has accelerated due to the 43% increase in debt servicing costs along with a $31 billion dollar increase in defense spending from a year earlier. Additionally, a $30 billion increase in funding for the Federal Deposit Insurance Corporation in light of the regional banking crisis last year was a major contributor to the deficit increase.
Overall, the CBO forecasts that roughly 75% of the federal deficit’s increase will be due to interest costs by 2034.

-

 Green2 weeks ago
Ranked: Top Countries by Total Forest Loss Since 2001
-

 Travel1 week ago
Ranked: The World’s Top Flight Routes, by Revenue
-

 Technology2 weeks ago
Ranked: Semiconductor Companies by Industry Revenue Share
-

 Money2 weeks ago
Which States Have the Highest Minimum Wage in America?
-

 Real Estate2 weeks ago
Ranked: The Most Valuable Housing Markets in America
-

 Markets2 weeks ago
Charted: Big Four Market Share by S&P 500 Audits
-

 AI2 weeks ago
The Stock Performance of U.S. Chipmakers So Far in 2024
-

 Automotive2 weeks ago
Almost Every EV Stock is Down After Q1 2024