Energy
How Green is Your State or Province?
In countries where energy is plentiful, most people don’t think twice before plugging into the grid.
Whether it is for a simple top up for your smartphone battery at the airport or the continuous energy chug of household appliances, it’s easy to take the electricity we use for granted.
But do you know where your electricity comes from – and whether it is green or not?
Drilling Down by State and Province
Today’s maps come from Reddit users Dr_Engineerd and PaulsEggo, who have used data from national energy administration agencies for the U.S. and Canada to show what percentage of electricity generated in each state or province is green.
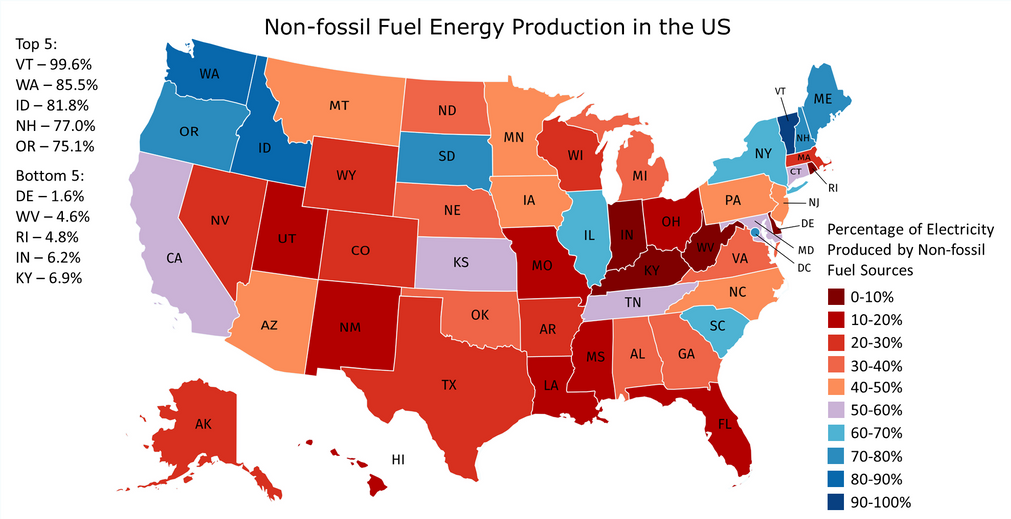
Let’s start with the map of the United States:
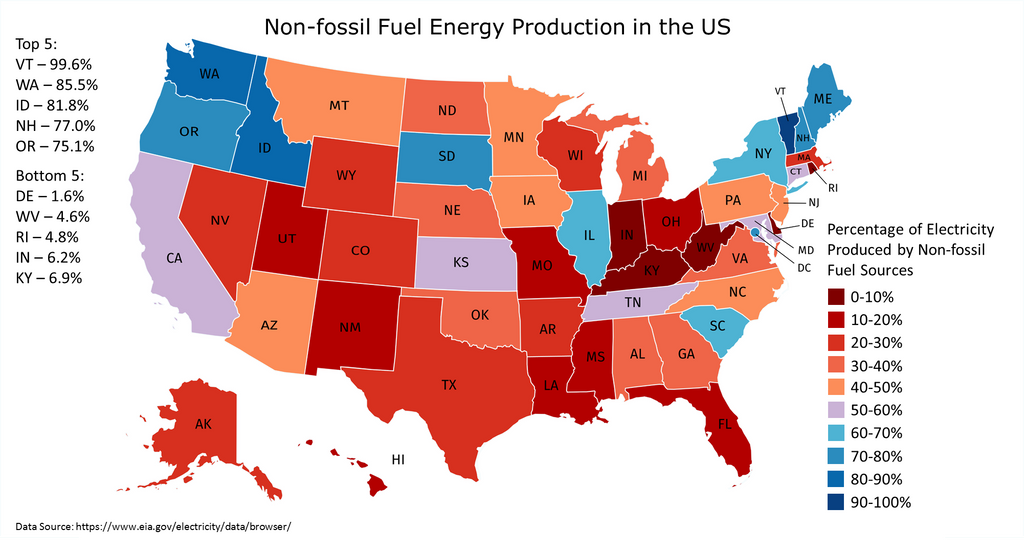
The above map combines electricity generation for all renewable forms of energy (such as solar, wind, geothermal, or hydro) with nuclear, which is considered a sustainable energy source by many experts.
The top five states are as follows:
| Rank | State | % of green energy | Top energy source |
|---|---|---|---|
| #1 | Vermont | 99.6% | Hydro |
| #2 | Washington | 85.5% | Hydro |
| #3 | Idaho | 81.8% | Hydro |
| #4 | New Hampshire | 77.0% | Nuclear |
| #5 | Oregon | 75.1% | Hydro |
Vermont leads the way with an impressive 99.6% mix for electricity generated. Also notable is New Hampshire, which makes the list thanks to its heavy usage of nuclear – the state’s Seabrook nuclear plant (1,244 MW) is the largest individual electrical generating unit on the New England power grid.
Now, here are the bottom five states:
| Rank | State | % of green energy | Top energy source |
|---|---|---|---|
| #47 | Kentucky | 6.9% | Coal |
| #48 | Indiana | 6.2% | Coal |
| #49 | Rhode Island | 4.8% | Natural gas |
| #50 | West Virginia | 4.6% | Coal |
| #51 | Delaware | 1.6% | Natural gas |
West Virginia, Kentucky, and Indiana still get the majority of their electricity from coal.
That’s not to say states like Indiana have not been investing in green power – the state actually ranks 12th in the U.S. for wind capacity. It’s just not enough to make a dent in the larger energy mix.
A Look Up North
Finally, here’s a similar look, but this time at Canadian provinces and territories:
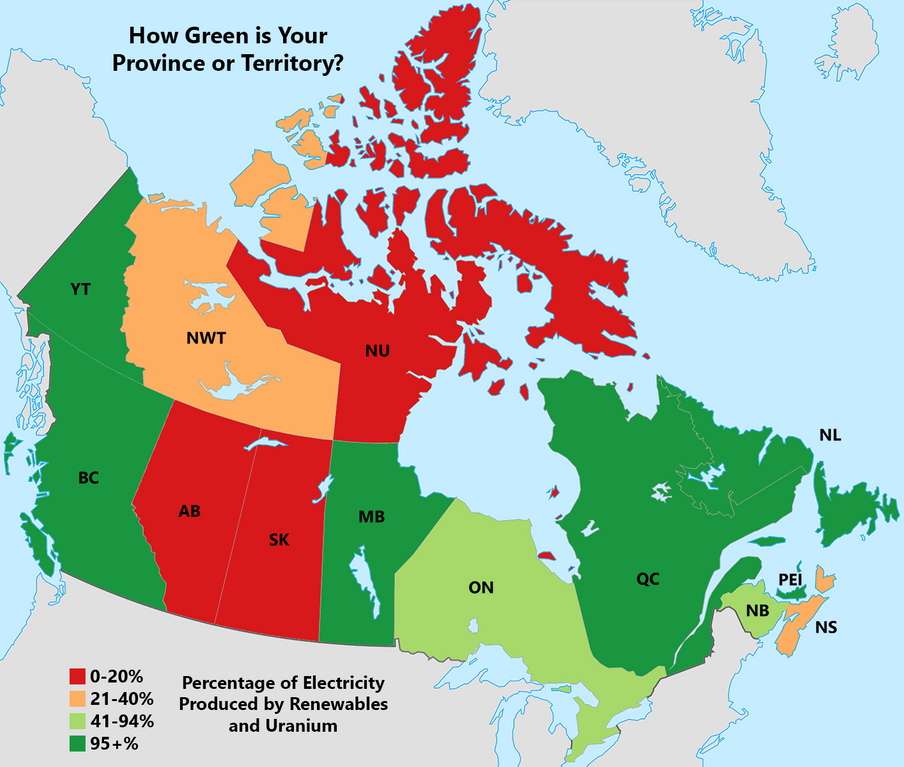
Regions like British Columbia, Manitoba, Yukon, Newfoundland, and Quebec are known for their hydro power – all get over 85% of their electricity from hydro alone. Meanwhile, Prince Edward Island gets the vast majority of its power from wind.
On the flipside, the only three provinces or territories below the 20% green threshold are Alberta, Saskatchewan, and Nunavut.


Energy
The World’s Biggest Nuclear Energy Producers
China has grown its nuclear capacity over the last decade, now ranking second on the list of top nuclear energy producers.


The World’s Biggest Nuclear Energy Producers
This was originally posted on our Voronoi app. Download the app for free on Apple or Android and discover incredible data-driven charts from a variety of trusted sources.
Scientists in South Korea recently broke a record in a nuclear fusion experiment. For 48 seconds, they sustained a temperature seven times that of the sun’s core.
But generating commercially viable energy from nuclear fusion still remains more science fiction than reality. Meanwhile, its more reliable sibling, nuclear fission, has been powering our world for many decades.
In this graphic, we visualized the top producers of nuclear energy by their share of the global total, measured in terawatt hours (TWh). Data for this was sourced from the Nuclear Energy Institute, last updated in August 2022.
Which Country Generates the Most Nuclear Energy?
Nuclear energy production in the U.S. is more than twice the amount produced by China (ranked second) and France (ranked third) put together. In total, the U.S. accounts for nearly 30% of global nuclear energy output.
However, nuclear power only accounts for one-fifth of America’s electricity supply. This is in contrast to France, which generates 60% of its electricity from nuclear plants.
| Rank | Country | Nuclear Energy Produced (TWh) | % of Total |
|---|---|---|---|
| 1 | 🇺🇸 U.S. | 772 | 29% |
| 2 | 🇨🇳 China | 383 | 14% |
| 3 | 🇫🇷 France | 363 | 14% |
| 4 | 🇷🇺 Russia | 208 | 8% |
| 5 | 🇰🇷 South Korea | 150 | 6% |
| 6 | 🇨🇦 Canada | 87 | 3% |
| 7 | 🇺🇦 Ukraine | 81 | 3% |
| 8 | 🇩🇪 Germany | 65 | 2% |
| 9 | 🇯🇵 Japan | 61 | 2% |
| 10 | 🇪🇸 Spain | 54 | 2% |
| 11 | 🇸🇪 Sweden | 51 | 2% |
| 12 | 🇧🇪 Belgium | 48 | 2% |
| 13 | 🇬🇧 UK | 42 | 2% |
| 14 | 🇮🇳 India | 40 | 2% |
| 15 | 🇨🇿 Czech Republic | 29 | 1% |
| N/A | 🌐 Other | 219 | 8% |
| N/A | 🌍 Total | 2,653 | 100% |
Another highlight is how China has rapidly grown its nuclear energy capabilities in the last decade. Between 2016 and 2021, for example, it increased its share of global nuclear energy output from less than 10% to more than 14%, overtaking France for second place.
On the opposite end, the UK’s share has slipped to 2% over the same time period.
Meanwhile, Ukraine has heavily relied on nuclear energy to power its grid. In March 2022, it lost access to its key Zaporizhzhia Nuclear Power Station after Russian forces wrested control of the facility. With six 1,000 MW reactors, the plant is one of the largest in Europe. It is currently not producing any power, and has been the site of recent drone attacks.

-

 Real Estate2 weeks ago
Visualizing America’s Shortage of Affordable Homes
-

 Technology1 week ago
Ranked: Semiconductor Companies by Industry Revenue Share
-

 Money1 week ago
Which States Have the Highest Minimum Wage in America?
-

 Real Estate1 week ago
Ranked: The Most Valuable Housing Markets in America
-

 Business2 weeks ago
Charted: Big Four Market Share by S&P 500 Audits
-

 AI2 weeks ago
The Stock Performance of U.S. Chipmakers So Far in 2024
-

 Misc2 weeks ago
Almost Every EV Stock is Down After Q1 2024
-

 Money2 weeks ago
Where Does One U.S. Tax Dollar Go?