Markets
Hedge Fund Rich List: Who Stayed Afloat in Worst Year Since 2008?
Hedge Fund Rich List: Who Stayed Afloat in Worst Year Since 2008?
Every year, Institutional Investor’s Alpha documents the performance of the world’s most elite investors: hedge fund managers. The Hedge Fund Rich List, in its 14th year of publication, is a “who’s who” of the industry and highlights the performances of the most successful investment managers in the world.
Our infographic today is based on this report, and it breaks down the last year for this elite group.
The Worst Year Since the Financial Crisis
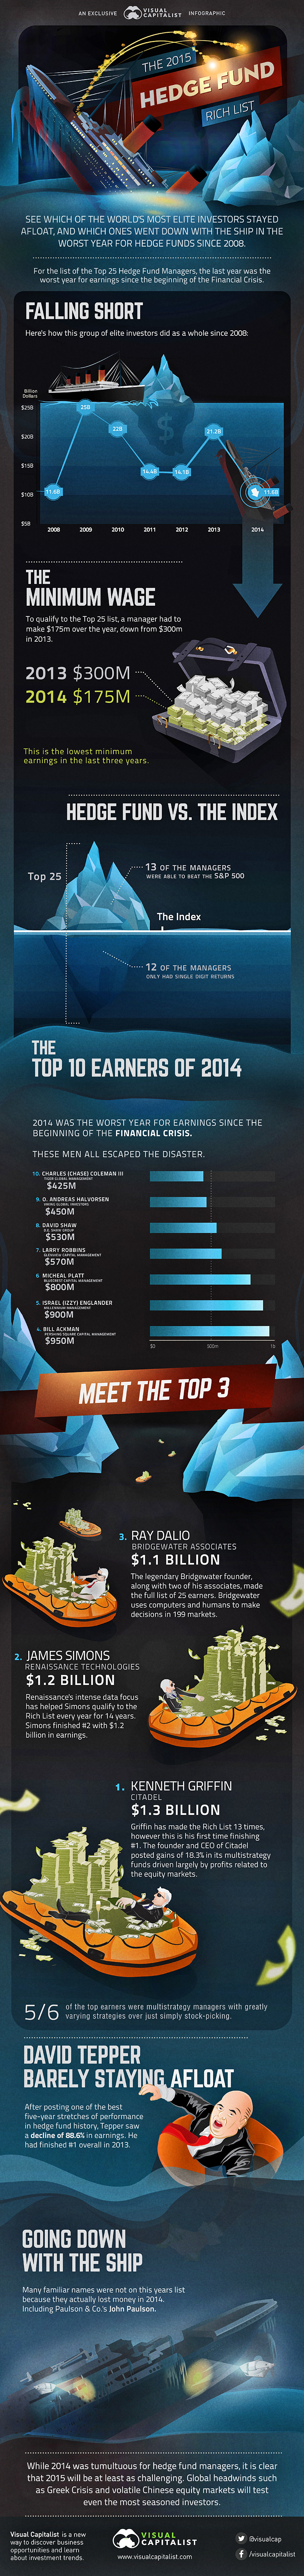
The performance of this collective of top-notch investors was the worst as a whole since the Financial Crisis in 2008. In the previous five years, their total earnings averaged $19.3 billion. Last year, the group brought in a paltry $11.6 billion. This brought average earnings per person down to $467 million over the year from $846 million in 2013.
This is counterintuitive based on the fact that the S&P 500 gained an impressive 13.7% on the year in 2014. Interestingly, only about half of the managers beat the index’s performance, with the rest falling into single-digit return territory.
Minimum Wage
The minimum amount of earnings to make the list dropped significantly from $300 million to $175 million. This is the lowest minimum earnings in the last three years.
David Tepper, of Appaloosa Management, is barely staying afloat. After having one of the best five-year stretches of performance in hedge fund history, he saw his earnings decline 88.6% in 2014. He had finished #1 overall in 2013, but only saw a 2.2% gain over the last year.
Many managers were not even lucky enough to get the “minimum wage”.
John Paulson of Paulson & Co., who famously made his fortune betting against the US Housing Market in 2007, ended up tanking in 2014 with his second worst year ever. His Advantage Plus fund fell 36% while his Advantage fund dropped 29%.
The Top 10 Investors
The managers that had the highest returns were as follows:
10. Charles (Chase) Coleman III of Tiger Global Management – $425 million
9. O. Andreas Halvorsen of Viking Global Investors – $450 million
8. David Shaw of D.E. Shaw Group – $530 million
7. Larry Robbins of Glenview Capital Management – $570 million
6. Michael Platt of BlueCrest Capital Management – $800 million
5. Israel (Izzy) Englander of Millennium Management – $900 million
4. Bill Ackman of Pershing Square Capital Management – $950 million
3. Ray Dalio of Bridgewater Associates – $1.1 billion
2. James Simons of Renaissance Technologies – $1.2 billion
1. Kenneth Griffin of Citadel – $1.3 billion
Profiles on those that broke $1 billion:
Ray Dalio, the legendary founder of Bridgewater Associates, along with two of his associates, made the full list of 25 earners. Bridgewater uses computers and humans to make decisions in 199 markets. Ray took home $1.1 billion.
Renaissance’s intense data focus helped James Simons qualify to the Rich List every year for the last 14 years. He finished #2 with $1.2 billion in earnings.
Kenneth Griffin has made the Rich List 13 times, however this is his first time finishing #1 overall. The founder and CEO of Citadel posted gains of 18.3% in its multistrategy funds driven largely by profits related to the equity markets.
What’s Ahead for 2015?
While 2014 was a tumultuous year for hedge fund managers, it is clear 2015 will be at least as challenging and interesting. Global headwinds such as the Greek Crisis and volatile Chinese equity markets will test even the most seasoned investors.


Markets
Ranked: The Largest U.S. Corporations by Number of Employees
We visualized the top U.S. companies by employees, revealing the massive scale of retailers like Walmart, Target, and Home Depot.


The Largest U.S. Corporations by Number of Employees
This was originally posted on our Voronoi app. Download the app for free on Apple or Android and discover incredible data-driven charts from a variety of trusted sources.
Revenue and profit are common measures for measuring the size of a business, but what about employee headcount?
To see how big companies have become from a human perspective, we’ve visualized the top U.S. companies by employees. These figures come from companiesmarketcap.com, and were accessed in March 2024. Note that this ranking includes publicly-traded companies only.
Data and Highlights
The data we used to create this list of largest U.S. corporations by number of employees can be found in the table below.
| Company | Sector | Number of Employees |
|---|---|---|
| Walmart | Consumer Staples | 2,100,000 |
| Amazon | Consumer Discretionary | 1,500,000 |
| UPS | Industrials | 500,000 |
| Home Depot | Consumer Discretionary | 470,000 |
| Concentrix | Information Technology | 440,000 |
| Target | Consumer Staples | 440,000 |
| Kroger | Consumer Staples | 430,000 |
| UnitedHealth | Health Care | 400,000 |
| Berkshire Hathaway | Financials | 383,000 |
| Starbucks | Consumer Discretionary | 381,000 |
| Marriott International | Consumer Discretionary | 377,000 |
| Cognizant | Information Technology | 346,600 |
Retail and Logistics Top the List
Companies like Walmart, Target, and Kroger have a massive headcount due to having many locations spread across the country, which require everything from cashiers to IT professionals.
Moving goods around the world is also highly labor intensive, explaining why UPS has half a million employees globally.
Below the Radar?
Two companies that rank among the largest U.S. corporations by employees which may be less familiar to the public include Concentrix and Cognizant. Both of these companies are B2B brands, meaning they primarily work with other companies rather than consumers. This contrasts with brands like Amazon or Home Depot, which are much more visible among average consumers.
A Note on Berkshire Hathaway
Warren Buffett’s company doesn’t directly employ 383,000 people. This headcount actually includes the employees of the firm’s many subsidiaries, such as GEICO (insurance), Dairy Queen (retail), and Duracell (batteries).
If you’re curious to see how Buffett’s empire has grown over the years, check out this animated graphic that visualizes the growth of Berkshire Hathaway’s portfolio from 1994 to 2022.

-

 Business2 weeks ago
America’s Top Companies by Revenue (1994 vs. 2023)
-

 Environment1 week ago
Ranked: Top Countries by Total Forest Loss Since 2001
-

 Markets1 week ago
Visualizing America’s Shortage of Affordable Homes
-

 Maps2 weeks ago
Mapped: Average Wages Across Europe
-

 Mining2 weeks ago
Charted: The Value Gap Between the Gold Price and Gold Miners
-

 Demographics2 weeks ago
Visualizing the Size of the Global Senior Population
-

 Misc2 weeks ago
Tesla Is Once Again the World’s Best-Selling EV Company
-

 Technology2 weeks ago
Ranked: The Most Popular Smartphone Brands in the U.S.