Money
Visualizing the Global Millionaire Population
Visualizing the Global Millionaire Population
A look at wealth by region, fortune size, and city
The Chart of the Week is a weekly Visual Capitalist feature on Fridays.
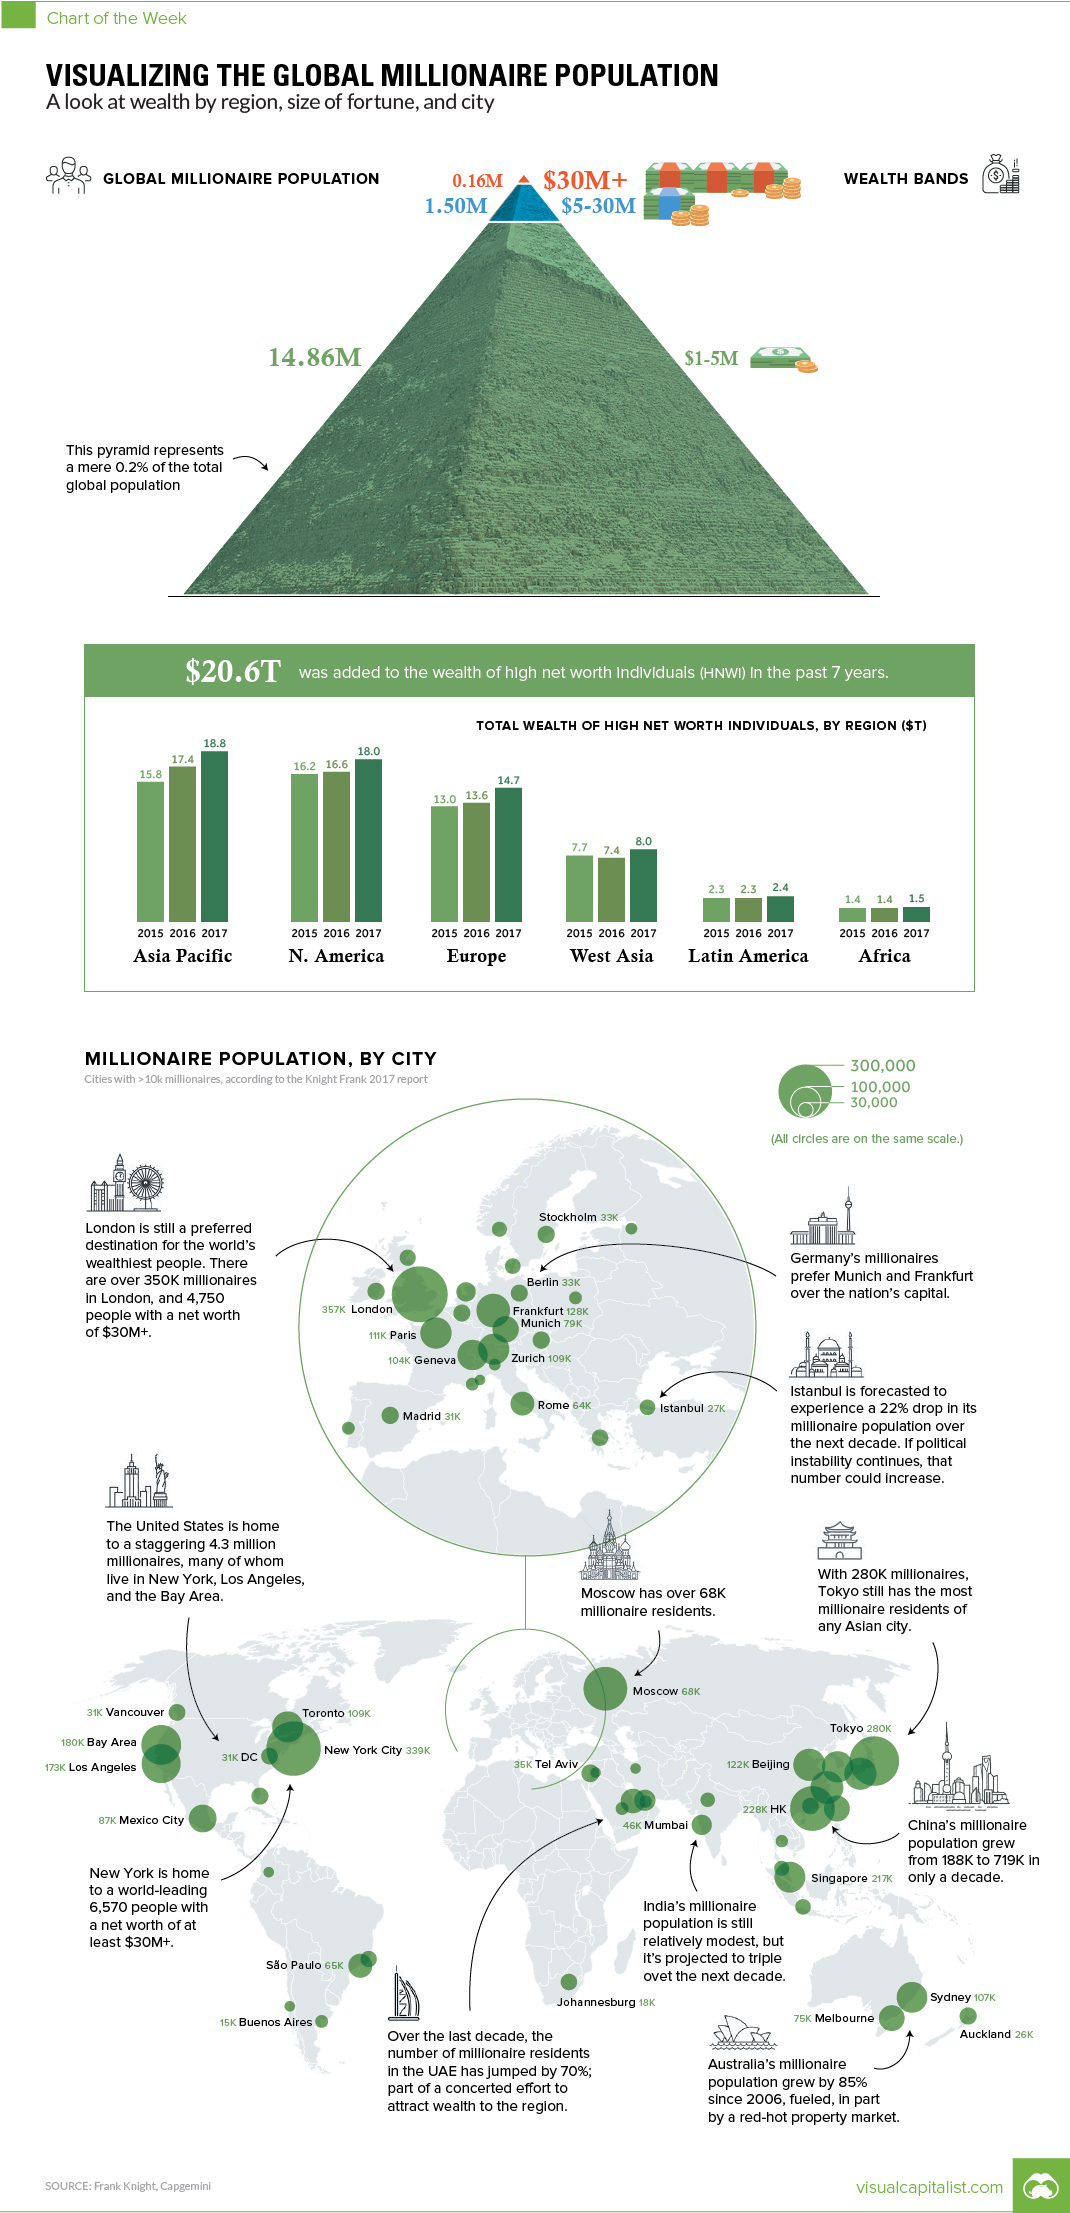
When we think of the term “millionaire”, it’s only natural for our thoughts to be skewed towards the famous business magnates that have amassed giant fortunes, like Jeff Bezos, Elon Musk, or Warren Buffett.
However, the reality is that those types of ultra high net worth individuals (UHNWIs) with fortunes above $30 million are a fairly rare commodity – and when it’s all said and done, they make up a very tiny percentage of the millionaire population as a whole.
| Fortune Size | Number (Globally) | % of Millionaire Population |
|---|---|---|
| $30+ mm | 160,000 | 1.0% |
| $5mm - $30mm | 1,500,000 | 9.1% |
| $1mm - $5mm | 14,860,000 | 90.0% |
The vast majority of millionaires (90.0%) globally have fortunes between $1 million and $5 million, and you’re probably not going to find many of them with a sprawling mansion or a new Rolls Royce in the garage.
In fact, most millionaires drive a Ford.
Local Millionaires
So where will you find all of the world’s millionaires?
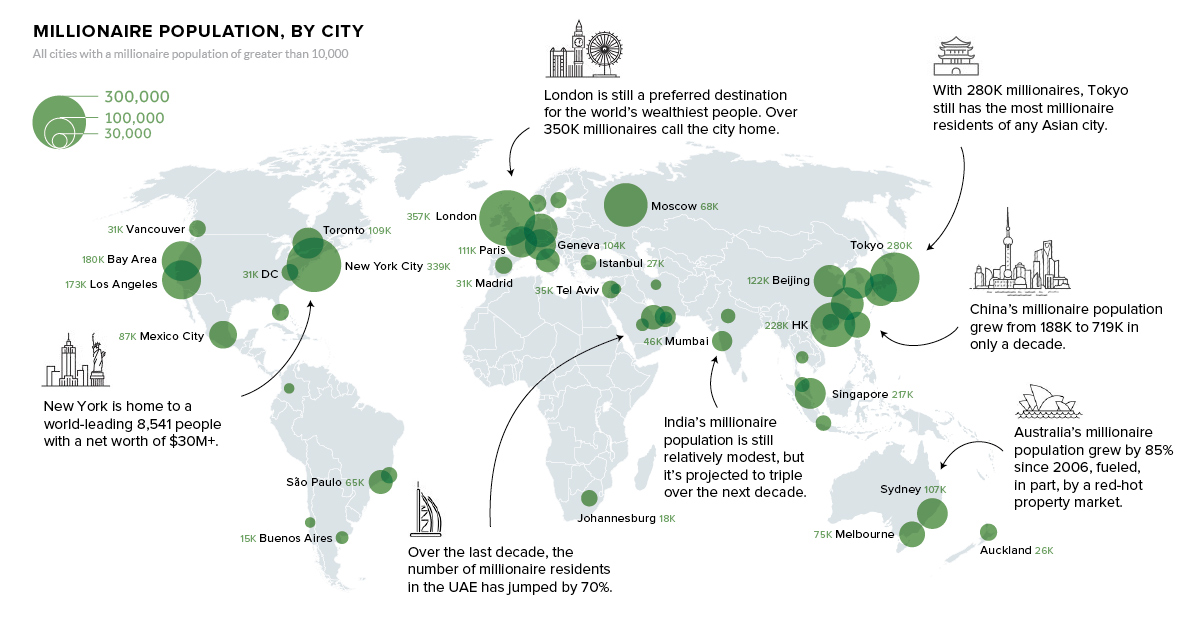
They are most likely to be found in big cities – places where they can use and display their wealth. These are also the places where big opportunities tend to be found, so it’s no surprise to see millionaires cluster in world-class cities like New York, Hong Kong, London, Tokyo, or Singapore.
Regions below are sorted by the total millionaires in each city. Data comes from the Knight Frank 2017 report.
Top Cities in Asia
| Rank (Asia) | City | Country | # of Millionaires |
|---|---|---|---|
| #1 | Tokyo | Japan | 279,800 |
| #2 | Hong Kong | Hong Kong | 227,900 |
| #3 | Singapore | Singapore | 217,300 |
| #4 | Beijing | China | 122,100 |
| #5 | Osaka | Japan | 117,700 |
| #6 | Shanghai | China | 117,600 |
| #7 | Seoul | South Korea | 108,100 |
| #8 | Taipei | Taiwan | 76,700 |
| #9 | Mumbai | India | 46,100 |
| #10 | Shenzhen | China | 31,400 |
Tokyo, Hong Kong, and Singapore are the undisputed millionaire population capitals in Asia, but mainland China is coming up quick from behind.
In just the last 10 years, China has upped its millionaire count by 281% to 719,400 in total – and Beijing (with 122,100 millionaires) now cracks the top five list in Asia.
Top Cities in Oceania
| Rank (Oceania) | City | City | # of Millionaires |
|---|---|---|---|
| #1 | Sydney | Australia | 106,800 |
| #2 | Melbourne | Australia | 74,800 |
| #3 | Auckland | New Zealand | 25,600 |
Australia’s millionaire count has soared 85% over the last 10 years, thanks in part to red-hot property prices.
Top Cities in Europe
| Rank (Europe) | City | Country | # of Millionaires |
|---|---|---|---|
| #1 | London | UK | 357,200 |
| #2 | Frankfurt | Germany | 128,300 |
| #3 | Paris | France | 110,900 |
| #4 | Zurich | Switzerland | 109,200 |
| #5 | Geneva | Switzerland | 104,300 |
| #6 | Munich | Germany | 78,900 |
| #7 | Moscow | Russia | 68,200 |
| #8 | Rome | Italy | 64,300 |
| #9 | Amsterdam | Netherlands | 42,600 |
| #10 | Brussels | Belgium | 34,700 |
London is the millionaire capital for the world, with 357,200 of them.
Despite its relatively small size in comparison to the European heavyweights, Switzerland also has two cities in the top five: Geneva and Zurich.
Top Cities in the Middle East
| Rank (Middle East) | City | Country | # of Millionaires |
|---|---|---|---|
| #1 | Dubai | UAE | 50,400 |
| #2 | Tel Aviv | Israel | 35,200 |
| #3 | Istanbul | Turkey | 27,300 |
| #4 | Doha | Qatar | 25,800 |
| #5 | Abu Dhabi | UAE | 17,100 |
| #6 | Riyadh | Saudi Arabia | 16,200 |
| #7 | Tehran | Iran | 14,000 |
| #8 | Jerusalem | Israel | 13,100 |
Not surprisingly, Dubai is the biggest destination for the ultra-rich to flock to in the Middle East.
Top Cities in Latin America
| Rank (Latin America) | City | Country | # of Millionaires |
|---|---|---|---|
| #1 | Mexico City | Mexico | 86,700 |
| #2 | São Paulo | Brazil | 64,500 |
| #3 | Rio de Janeiro | Brazil | 35,300 |
| #4 | Buenos Aires | Argentina | 15,400 |
| #5 | Bogota | Colombia | 14,900 |
| #6 | Santiago | Chile | 10,800 |
Mexico City, and then the two big ones in Brazil (São Paulo and Rio), are where millionaires congregate in Latin America.
Top Cities in North America
| Rank (North America) | City | Country | # of Millionaires |
|---|---|---|---|
| #1 | New York City | USA | 339,200 |
| #2 | Bay Area | USA | 180,300 |
| #3 | Los Angeles | USA | 173,300 |
| #4 | Toronto | Canada | 109,300 |
| #5 | Miami | USA | 31,600 |
| #6 | Washington D.C. | USA | 31,200 |
| #7 | Vancouver | Canada | 31,100 |
The U.S. has 4.3 million millionaires, and they are widely dispersed through the country.
The Knight Frank 2017 report lists five cities: NYC, Washington, D.C., San Francisco (incl. Bay Area), Los Angeles, and Miami – all of which, according to their calculations, have more than 30k millionaires.
Canada’s Toronto also has broken the six-digit barrier with over 100,000 millionaires. That puts the Big Smoke in pretty unique company, as only 17 cities globally can make such a claim.


Demographics
The Smallest Gender Wage Gaps in OECD Countries
Which OECD countries have the smallest gender wage gaps? We look at the 10 countries with gaps lower than the average.


The Smallest Gender Pay Gaps in OECD Countries
This was originally posted on our Voronoi app. Download the app for free on iOS or Android and discover incredible data-driven charts from a variety of trusted sources.
Among the 38 member countries in the Organization for Economic Cooperation and Development (OECD), several have made significant strides in addressing income inequality between men and women.
In this graphic we’ve ranked the OECD countries with the 10 smallest gender pay gaps, using the latest data from the OECD for 2022.
The gender pay gap is calculated as the difference between median full-time earnings for men and women divided by the median full-time earnings of men.
Which Countries Have the Smallest Gender Pay Gaps?
Luxembourg’s gender pay gap is the lowest among OECD members at only 0.4%—well below the OECD average of 11.6%.
| Rank | Country | Percentage Difference in Men's & Women's Full-time Earnings |
|---|---|---|
| 1 | 🇱🇺 Luxembourg | 0.4% |
| 2 | 🇧🇪 Belgium | 1.1% |
| 3 | 🇨🇷 Costa Rica | 1.4% |
| 4 | 🇨🇴 Colombia | 1.9% |
| 5 | 🇮🇪 Ireland | 2.0% |
| 6 | 🇭🇷 Croatia | 3.2% |
| 7 | 🇮🇹 Italy | 3.3% |
| 8 | 🇳🇴 Norway | 4.5% |
| 9 | 🇩🇰 Denmark | 5.8% |
| 10 | 🇵🇹 Portugal | 6.1% |
| OECD Average | 11.6% |
Notably, eight of the top 10 countries with the smallest gender pay gaps are located in Europe, as labor equality laws designed to target gender differences have begun to pay off.
The two other countries that made the list were Costa Rica (1.4%) and Colombia (1.9%), which came in third and fourth place, respectively.
How Did Luxembourg (Nearly) Eliminate its Gender Wage Gap?
Luxembourg’s virtually-non-existent gender wage gap in 2020 can be traced back to its diligent efforts to prioritize equal pay. Since 2016, firms that have not complied with the Labor Code’s equal pay laws have been subjected to penalizing fines ranging from €251 to €25,000.
Higher female education rates also contribute to the diminishing pay gap, with Luxembourg tied for first in the educational attainment rankings of the World Economic Forum’s Global Gender Gap Index Report for 2023.
See More Graphics about Demographics and Money
While these 10 countries are well below the OECD’s average gender pay gap of 11.6%, many OECD member countries including the U.S. are significantly above the average. To see the full list of the top 10 OECD countries with the largest gender pay gaps, check out this visualization.

-

 Technology2 weeks ago
Ranked: The Most Popular Smartphone Brands in the U.S.
-

 Automotive1 week ago
Almost Every EV Stock is Down After Q1 2024
-

 Money1 week ago
Where Does One U.S. Tax Dollar Go?
-

 Green2 weeks ago
Ranked: Top Countries by Total Forest Loss Since 2001
-

 Real Estate2 weeks ago
Visualizing America’s Shortage of Affordable Homes
-

 Maps2 weeks ago
Mapped: Average Wages Across Europe
-

 Mining2 weeks ago
Charted: The Value Gap Between the Gold Price and Gold Miners
-

 Demographics2 weeks ago
Visualizing the Size of the Global Senior Population