Technology
Chart: The Global Leaders in R&D Spending, by Country and Company
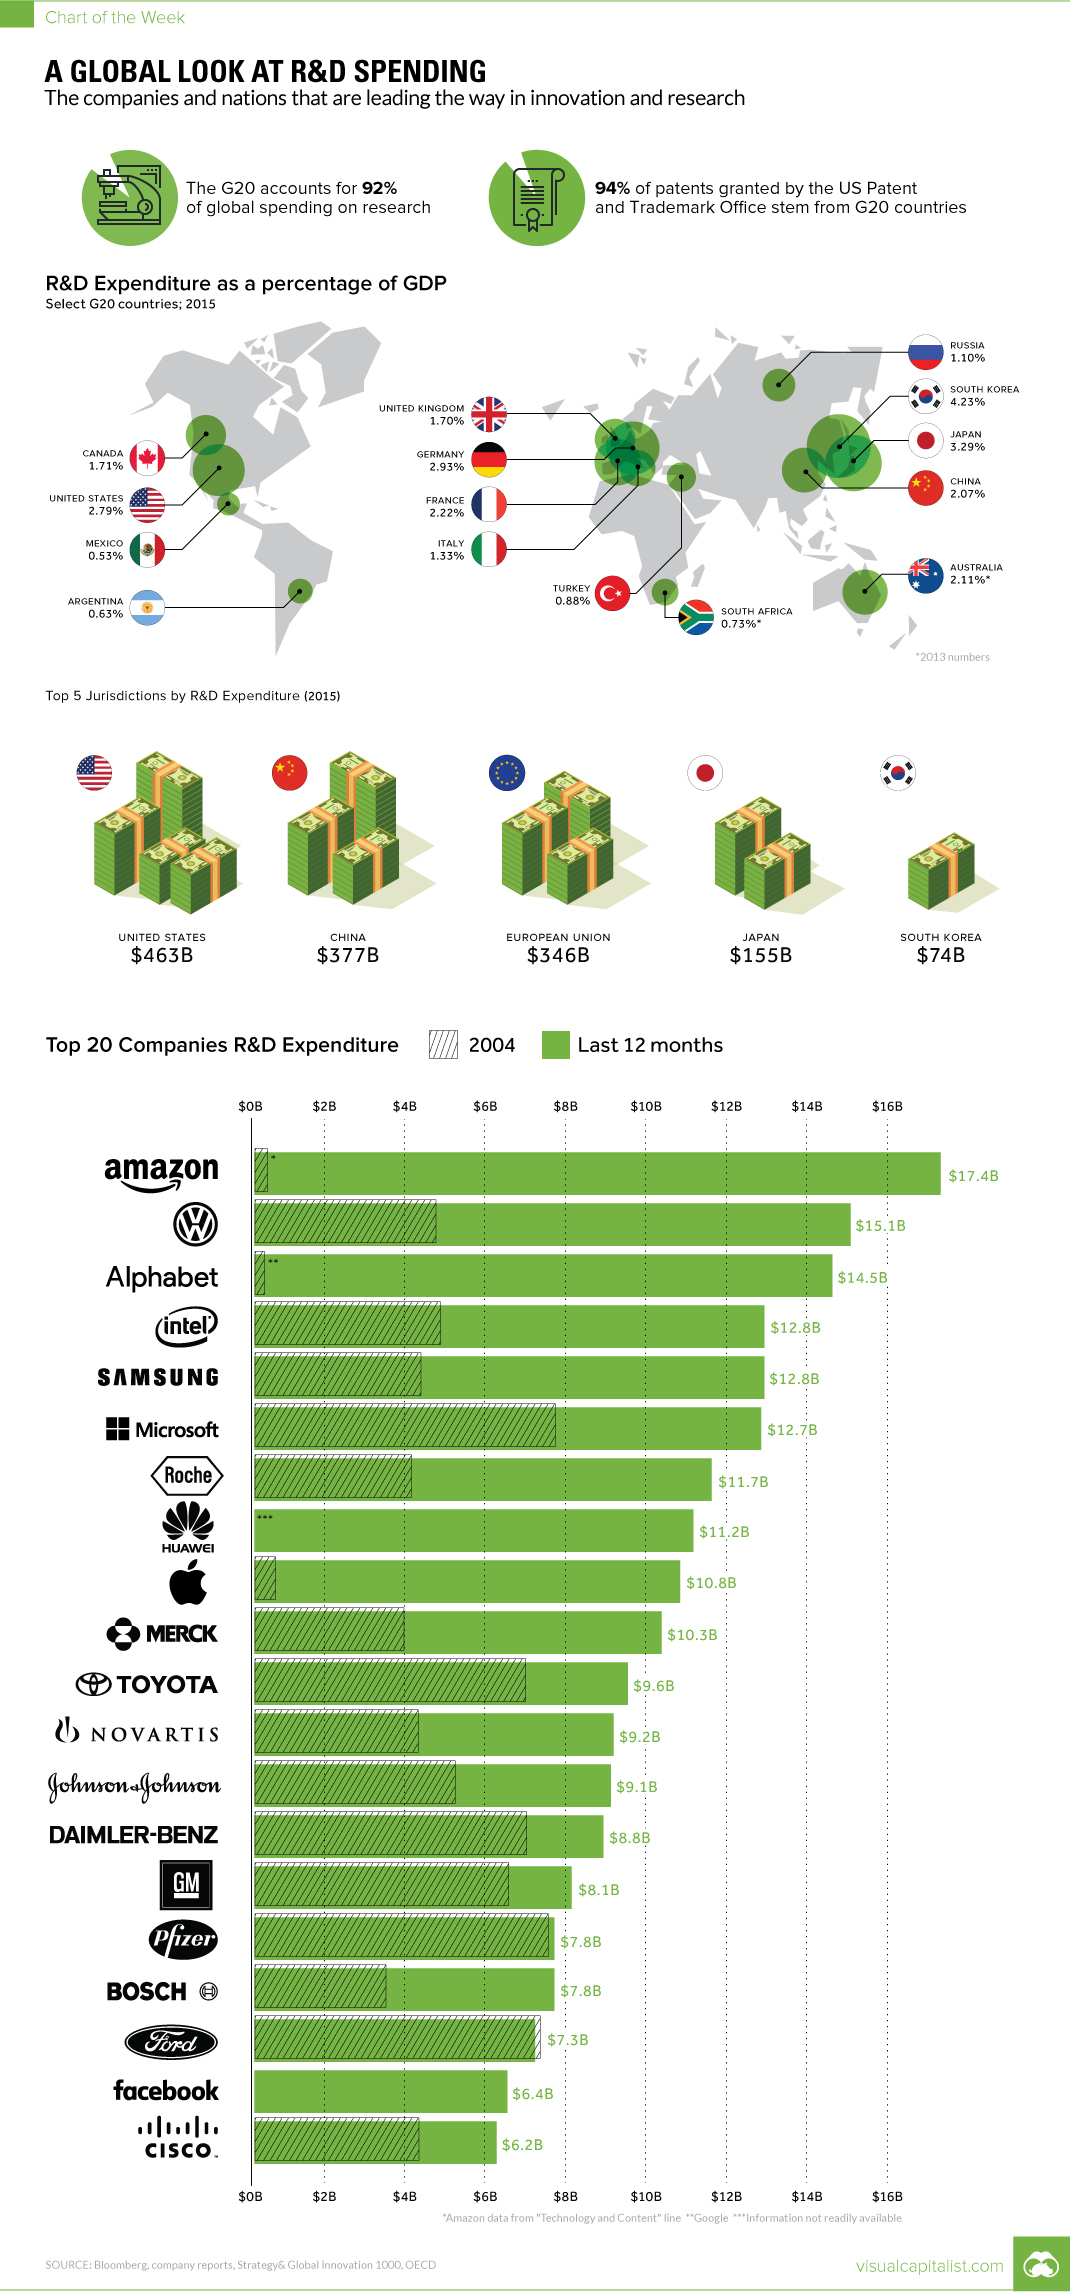
Chart: The Global Leaders in R&D Spending
The countries and firms that put the most into R&D
The Chart of the Week is a weekly Visual Capitalist feature on Fridays.
Given a choice of being the disruptor or the disrupted, many would prefer to choose the former.
But it’s not as easy as just flipping a switch and subsequently reaping the benefits of a forward-looking vision, new product categories, and forthcoming patents. Instead, an organization has to proactively acquire this innovation and intellectual capital from somewhere.
For many established companies, there is no other choice but to buy innovative startups through M&A to get their innovation fix, though this typically comes at a marked up price. On the flipside, especially for companies in tech, auto, and pharmaceutical spaces, innovation likely has to be in the DNA of the company culture, managerial decisions, and any new talent hired.
Global Leaders in R&D Spending
For those companies that aim to innovate internally, money needs to go into the research and development (R&D) line of their income statement.
Today’s chart looks at the countries that put the most into R&D (in % of GDP terms, and absolute $ terms), as well as the companies that have spent the most on R&D in the last 12 months trailing.
It’s also worth noting that money put into R&D is like any other investment – the money can be used wisely or simply squandered into initiatives that don’t pay off. Despite this, R&D spending is a loose approximation for global innovation.
R&D by Country
Global R&D spending is heavily concentrated in the G20 countries. In total they account for 92% of all R&D spending, and 94% of all patents granted at the U.S. Patent and Trademark office.
Here is a breakdown of R&D spending by GDP of select G20 countries:
| Country | R&D Spending (% GDP) |
|---|---|
| South Korea | 4.23% |
| Japan | 3.29% |
| Germany | 2.93% |
| United States | 2.79% |
| France | 2.22% |
| Australia | 2.11% |
| China | 2.07% |
| Canada | 1.71% |
| United Kingdom | 1.70% |
| Italy | 1.33% |
| Russia | 1.10% |
| Turkey | 0.88% |
| South Africa | 0.73% |
| Argentina | 0.63% |
| Mexico | 0.53% |
By total dollar spend, however, massive economies like the United States, China, and the EU take their rightful place.
| Rank | Economy | R&D Spending ($) in 2015 |
|---|---|---|
| #1 | United States | $463 billion |
| #2 | China | $377 billion |
| #3 | European Union | $346 billion |
| #4 | Japan | $155 billion |
| #5 | South Korea | $74 billion |
R&D by Company
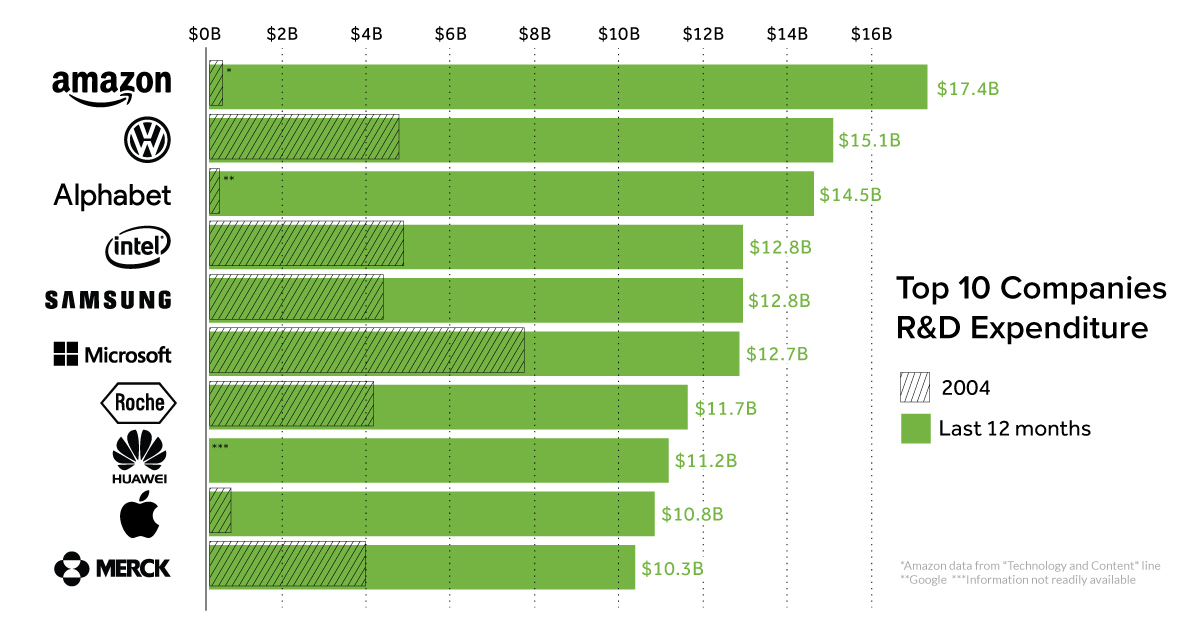
On a company basis, the top five R&D spenders today are mostly technology companies.
| Rank | Company | R&D Spending (Last 12 months) |
|---|---|---|
| #1 | Amazon | $17.4 billion |
| #2 | Volkswagen | $15.1 billion |
| #3 | Alphabet | $14.5 billion |
| #4 | Intel | $12.8 billion |
| #5 | Samsung | $12.8 billion |
Interestingly, that wasn’t always the case – even as short as 10 years ago, the largest R&D spenders tended to be pharmaceutical companies like Pfizer, or automobile manufacturers like GM and Volkswagen.
A final note: Amazon doesn’t list R&D on its income statement directly, and instead classifies everything under a “Technology and Content” line which includes R&D. While it is likely Amazon is an R&D leader, there isn’t an exact number for it as of now.


Technology
Ranked: Semiconductor Companies by Industry Revenue Share
Nvidia is coming for Intel’s crown. Samsung is losing ground. AI is transforming the space. We break down revenue for semiconductor companies.


Semiconductor Companies by Industry Revenue Share
This was originally posted on our Voronoi app. Download the app for free on Apple or Android and discover incredible data-driven charts from a variety of trusted sources.
Did you know that some computer chips are now retailing for the price of a new BMW?
As computers invade nearly every sphere of life, so too have the chips that power them, raising the revenues of the businesses dedicated to designing them.
But how did various chipmakers measure against each other last year?
We rank the biggest semiconductor companies by their percentage share of the industry’s revenues in 2023, using data from Omdia research.
Which Chip Company Made the Most Money in 2023?
Market leader and industry-defining veteran Intel still holds the crown for the most revenue in the sector, crossing $50 billion in 2023, or 10% of the broader industry’s topline.
All is not well at Intel, however, with the company’s stock price down over 20% year-to-date after it revealed billion-dollar losses in its foundry business.
| Rank | Company | 2023 Revenue | % of Industry Revenue |
|---|---|---|---|
| 1 | Intel | $51B | 9.4% |
| 2 | NVIDIA | $49B | 9.0% |
| 3 | Samsung Electronics | $44B | 8.1% |
| 4 | Qualcomm | $31B | 5.7% |
| 5 | Broadcom | $28B | 5.2% |
| 6 | SK Hynix | $24B | 4.4% |
| 7 | AMD | $22B | 4.1% |
| 8 | Apple | $19B | 3.4% |
| 9 | Infineon Tech | $17B | 3.2% |
| 10 | STMicroelectronics | $17B | 3.2% |
| 11 | Texas Instruments | $17B | 3.1% |
| 12 | Micron Technology | $16B | 2.9% |
| 13 | MediaTek | $14B | 2.6% |
| 14 | NXP | $13B | 2.4% |
| 15 | Analog Devices | $12B | 2.2% |
| 16 | Renesas Electronics Corporation | $11B | 1.9% |
| 17 | Sony Semiconductor Solutions Corporation | $10B | 1.9% |
| 18 | Microchip Technology | $8B | 1.5% |
| 19 | Onsemi | $8B | 1.4% |
| 20 | KIOXIA Corporation | $7B | 1.3% |
| N/A | Others | $126B | 23.2% |
| N/A | Total | $545B | 100% |
Note: Figures are rounded. Totals and percentages may not sum to 100.
Meanwhile, Nvidia is very close to overtaking Intel, after declaring $49 billion of topline revenue for 2023. This is more than double its 2022 revenue ($21 billion), increasing its share of industry revenues to 9%.
Nvidia’s meteoric rise has gotten a huge thumbs-up from investors. It became a trillion dollar stock last year, and broke the single-day gain record for market capitalization this year.
Other chipmakers haven’t been as successful. Out of the top 20 semiconductor companies by revenue, 12 did not match their 2022 revenues, including big names like Intel, Samsung, and AMD.
The Many Different Types of Chipmakers
All of these companies may belong to the same industry, but they don’t focus on the same niche.
According to Investopedia, there are four major types of chips, depending on their functionality: microprocessors, memory chips, standard chips, and complex systems on a chip.
Nvidia’s core business was once GPUs for computers (graphics processing units), but in recent years this has drastically shifted towards microprocessors for analytics and AI.
These specialized chips seem to be where the majority of growth is occurring within the sector. For example, companies that are largely in the memory segment—Samsung, SK Hynix, and Micron Technology—saw peak revenues in the mid-2010s.

-

 Real Estate2 weeks ago
Visualizing America’s Shortage of Affordable Homes
-

 Technology1 week ago
Ranked: Semiconductor Companies by Industry Revenue Share
-

 Money1 week ago
Which States Have the Highest Minimum Wage in America?
-

 Real Estate1 week ago
Ranked: The Most Valuable Housing Markets in America
-

 Business2 weeks ago
Charted: Big Four Market Share by S&P 500 Audits
-

 AI2 weeks ago
The Stock Performance of U.S. Chipmakers So Far in 2024
-

 Misc2 weeks ago
Almost Every EV Stock is Down After Q1 2024
-

 Money2 weeks ago
Where Does One U.S. Tax Dollar Go?