Markets
Four Maps Showing China’s Rising Dominance in Trade
We often use big, overarching ideas to help us understand the world and the opportunities contained within. These narratives, which can change over time, are used to create context. They give us a frame of reference for comprehending the news and events that affect our outlook on things.
China’s economic prowess is one of these new paradigms that has emerged, but many people still can’t really wrap their heads around the scale or scope of it.
It’s happened suddenly, and the ramifications are extremely relevant to our investments and understanding. Here’s four maps on China’s trade dominance that will help you think differently about the world:
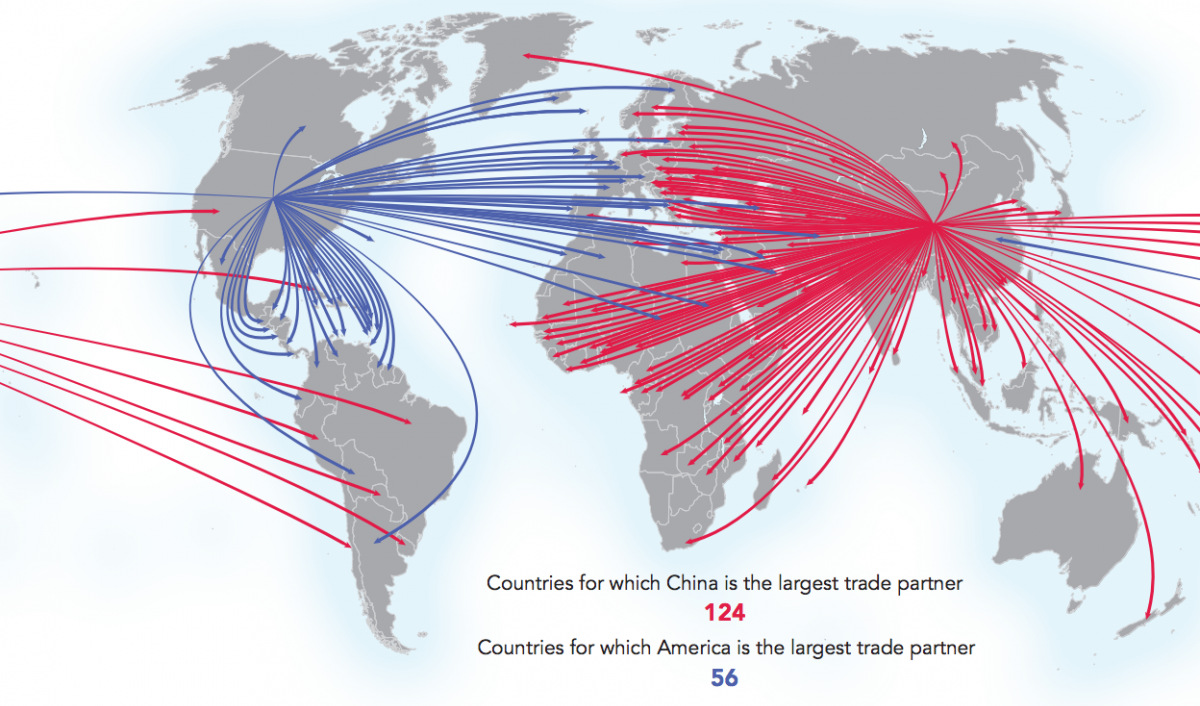
China is the world’s #1 trade partner
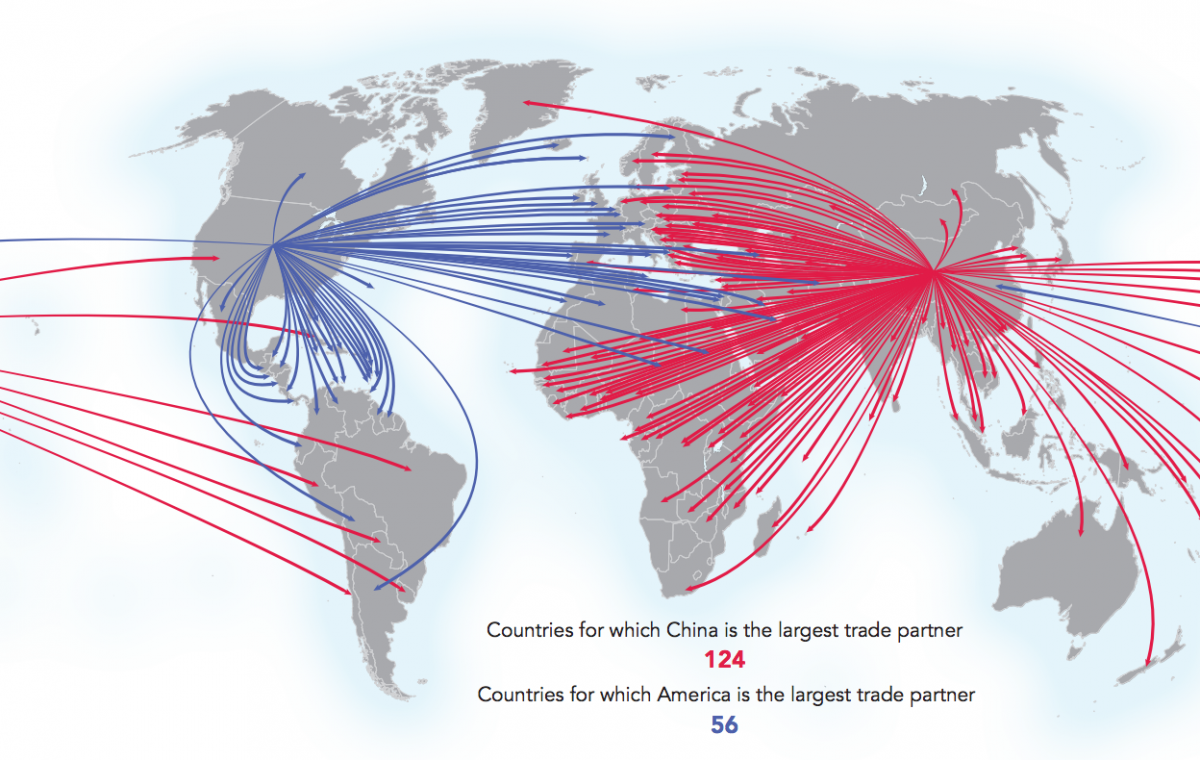
Image courtesy of: Connectography
The United States is the number one trading partner for 56 countries, with important relationships throughout North America, South America, and Western Europe.
Meanwhile, China is the top partner for 124 countries, dominating trade in Asia, Eastern Europe, Africa, and Australia.
China’s Sphere of Influence
This map shows the portion of trade conducted by each country with China in Southeast Asia.
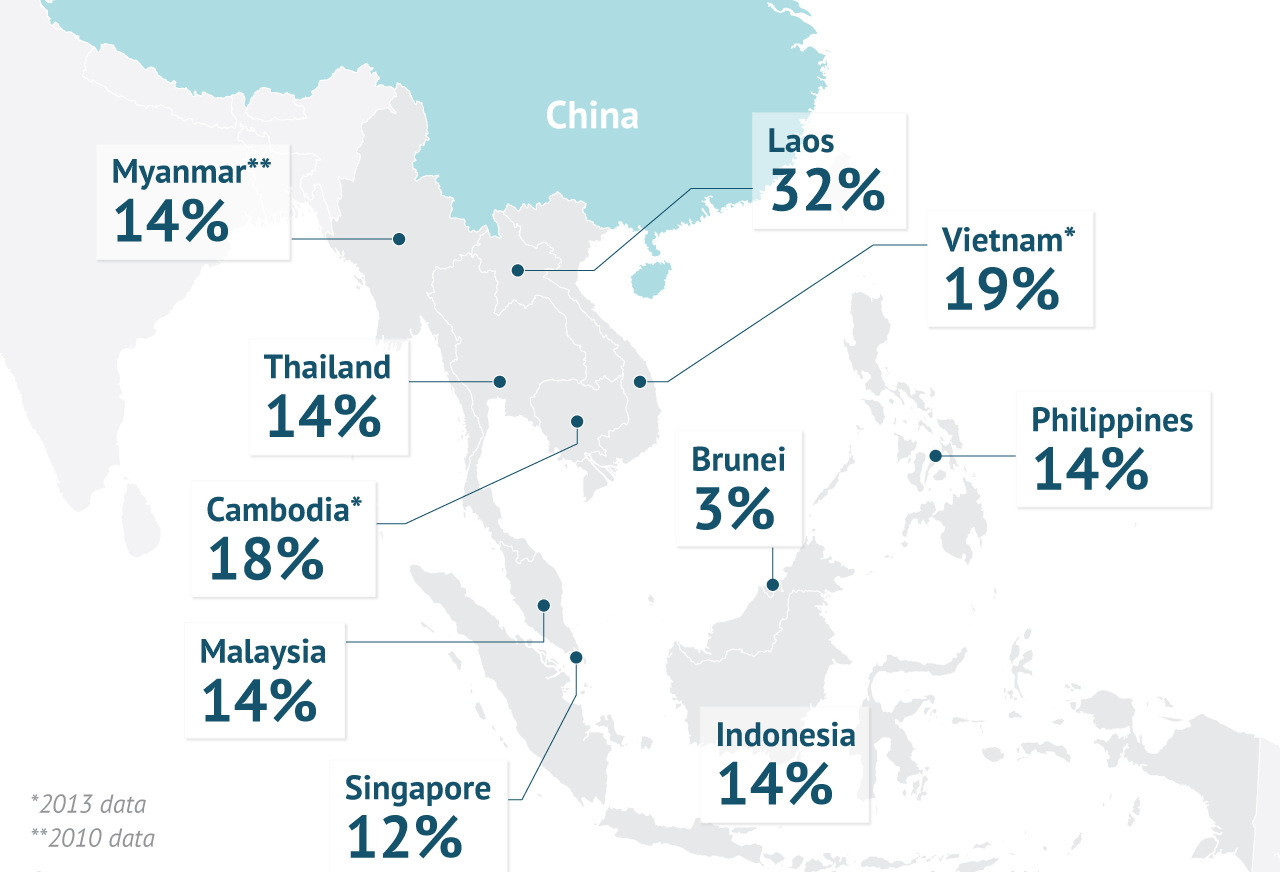
Image courtesy of: Stratfor
The influence that China has with nations in Southeast Asia is significant. Most trade is in double-digit percentages, and China views this as its immediate sphere of influence. Throughout history, territories in this region would even pay tribute to China to gain access to trade.
“In East Asia’s tribute system, China was the superior state, and many of its neighboring states were vassal states, and they maintained a relationship of tribute and rewards,” writes Liu Mingfu in The China Dream, a popular book about China’s plans to return to power.
Maintaining influence in Southeast Asia is part of the reason that Beijing is posturing in the South China Sea. In fact, China’s coastguard is growing so fast that in 10 years it will have more tonnage than all of the coastguards in Southeast Asia, the United States, and Japan combined.
Building a New Silk Road for Chinese Trade
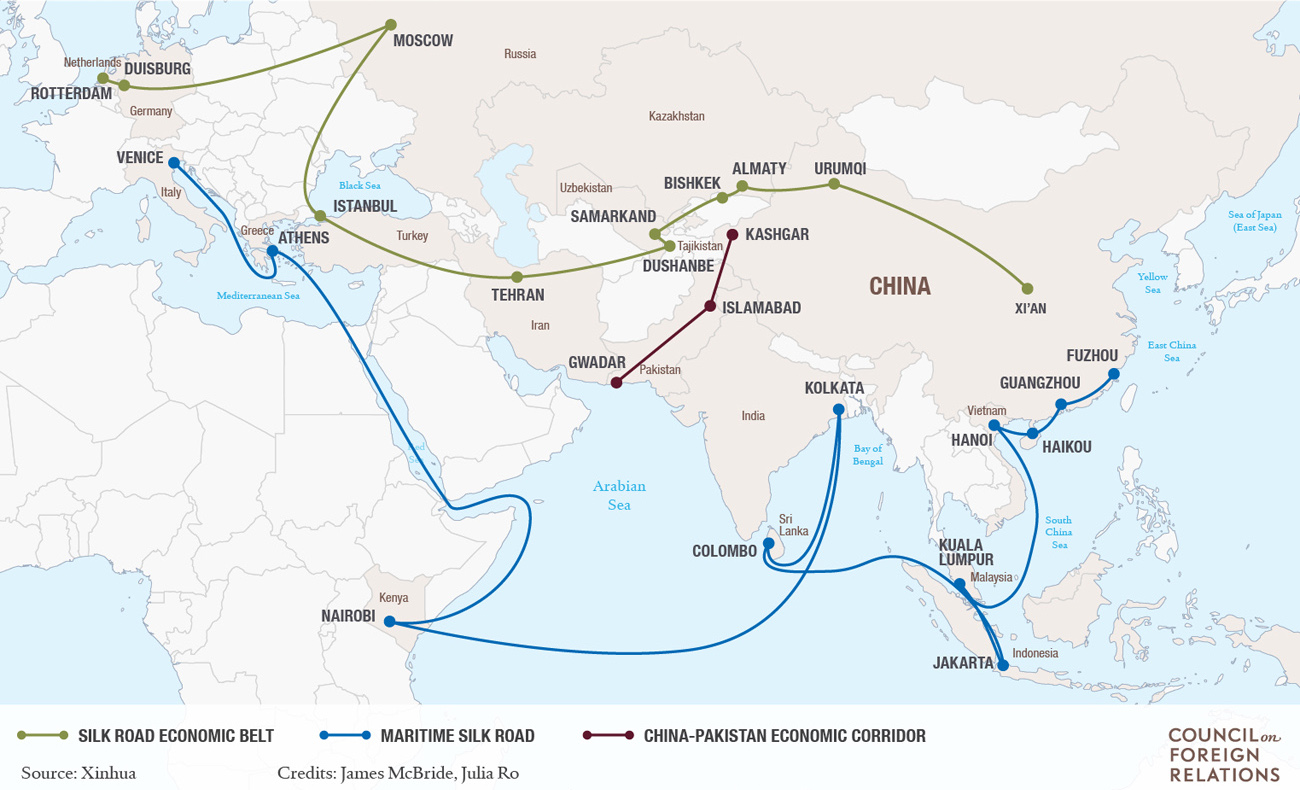
Image courtesy of: Council of Foreign Relations
China seeks to increase trade ties with Asia and Europe even further by building a new Silk Road that puts even Marco Polo’s route to shame.
The Chinese transcontinental network, a massive infrastructure project pegged for completion by 2025, is expected to bring down overland travel time from Beijing to London to just two days. Currently, it takes 15 days for the journey.
The project’s aim is to shorten the time of bulk consumer-goods transport to Europe, while unlocking the economic potential behind Eurasian cities from Almaty to Tehran. The new Silk Road will include at least one high-speed line that goes 320 km/h, and the network will help to link up 70% of the world’s population in roughly 40 countries.
Infrastructure Override
You may have heard of the AIIB (Asian Infrastructure Investment Bank), which was officially launched at the end of last year. Initially proposed by China, the bank now has over a $100 billion of capitalization and 57 founding member states.
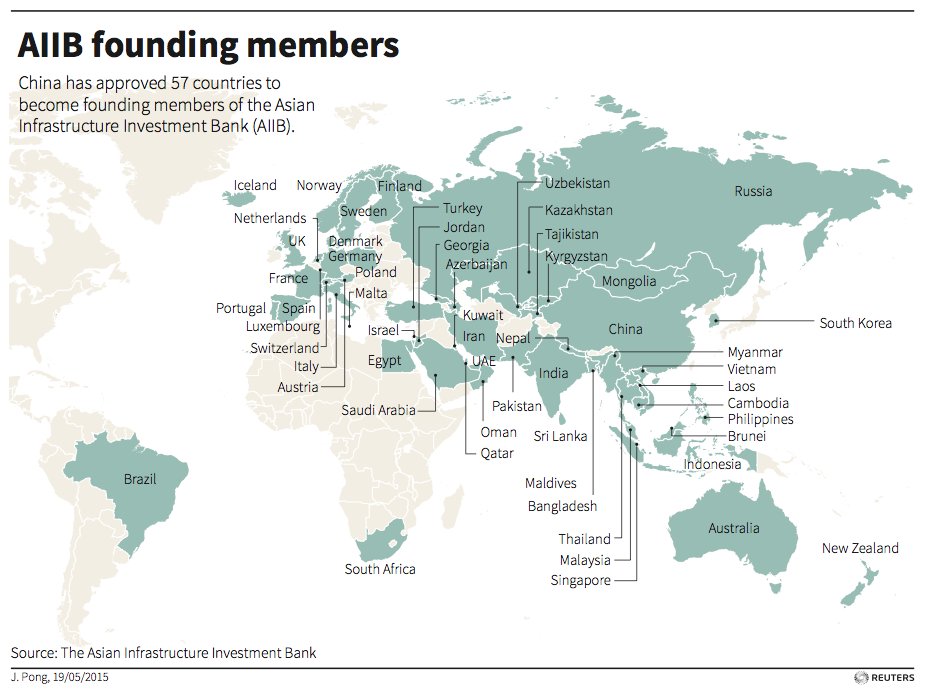
Image courtesy of: Reuters
While this shows China’s push for infrastructure especially to coincide with its new Silk Road, there is another very interesting detail: Beijing controls 26.06% of the votes, essentially giving it veto power as most bank decisions need 75% of the votes to pass.
In other words, only infrastructure projects that benefit Chinese trade will likely get the nod from Beijing.


Markets
U.S. Debt Interest Payments Reach $1 Trillion
U.S. debt interest payments have surged past the $1 trillion dollar mark, amid high interest rates and an ever-expanding debt burden.


U.S. Debt Interest Payments Reach $1 Trillion
This was originally posted on our Voronoi app. Download the app for free on iOS or Android and discover incredible data-driven charts from a variety of trusted sources.
The cost of paying for America’s national debt crossed the $1 trillion dollar mark in 2023, driven by high interest rates and a record $34 trillion mountain of debt.
Over the last decade, U.S. debt interest payments have more than doubled amid vast government spending during the pandemic crisis. As debt payments continue to soar, the Congressional Budget Office (CBO) reported that debt servicing costs surpassed defense spending for the first time ever this year.
This graphic shows the sharp rise in U.S. debt payments, based on data from the Federal Reserve.
A $1 Trillion Interest Bill, and Growing
Below, we show how U.S. debt interest payments have risen at a faster pace than at another time in modern history:
| Date | Interest Payments | U.S. National Debt |
|---|---|---|
| 2023 | $1.0T | $34.0T |
| 2022 | $830B | $31.4T |
| 2021 | $612B | $29.6T |
| 2020 | $518B | $27.7T |
| 2019 | $564B | $23.2T |
| 2018 | $571B | $22.0T |
| 2017 | $493B | $20.5T |
| 2016 | $460B | $20.0T |
| 2015 | $435B | $18.9T |
| 2014 | $442B | $18.1T |
| 2013 | $425B | $17.2T |
| 2012 | $417B | $16.4T |
| 2011 | $433B | $15.2T |
| 2010 | $400B | $14.0T |
| 2009 | $354B | $12.3T |
| 2008 | $380B | $10.7T |
| 2007 | $414B | $9.2T |
| 2006 | $387B | $8.7T |
| 2005 | $355B | $8.2T |
| 2004 | $318B | $7.6T |
| 2003 | $294B | $7.0T |
| 2002 | $298B | $6.4T |
| 2001 | $318B | $5.9T |
| 2000 | $353B | $5.7T |
| 1999 | $353B | $5.8T |
| 1998 | $360B | $5.6T |
| 1997 | $368B | $5.5T |
| 1996 | $362B | $5.3T |
| 1995 | $357B | $5.0T |
| 1994 | $334B | $4.8T |
| 1993 | $311B | $4.5T |
| 1992 | $306B | $4.2T |
| 1991 | $308B | $3.8T |
| 1990 | $298B | $3.4T |
| 1989 | $275B | $3.0T |
| 1988 | $254B | $2.7T |
| 1987 | $240B | $2.4T |
| 1986 | $225B | $2.2T |
| 1985 | $219B | $1.9T |
| 1984 | $205B | $1.7T |
| 1983 | $176B | $1.4T |
| 1982 | $157B | $1.2T |
| 1981 | $142B | $1.0T |
| 1980 | $113B | $930.2B |
| 1979 | $96B | $845.1B |
| 1978 | $84B | $789.2B |
| 1977 | $69B | $718.9B |
| 1976 | $61B | $653.5B |
| 1975 | $55B | $576.6B |
| 1974 | $50B | $492.7B |
| 1973 | $45B | $469.1B |
| 1972 | $39B | $448.5B |
| 1971 | $36B | $424.1B |
| 1970 | $35B | $389.2B |
| 1969 | $30B | $368.2B |
| 1968 | $25B | $358.0B |
| 1967 | $23B | $344.7B |
| 1966 | $21B | $329.3B |
Interest payments represent seasonally adjusted annual rate at the end of Q4.
At current rates, the U.S. national debt is growing by a remarkable $1 trillion about every 100 days, equal to roughly $3.6 trillion per year.
As the national debt has ballooned, debt payments even exceeded Medicaid outlays in 2023—one of the government’s largest expenditures. On average, the U.S. spent more than $2 billion per day on interest costs last year. Going further, the U.S. government is projected to spend a historic $12.4 trillion on interest payments over the next decade, averaging about $37,100 per American.
Exacerbating matters is that the U.S. is running a steep deficit, which stood at $1.1 trillion for the first six months of fiscal 2024. This has accelerated due to the 43% increase in debt servicing costs along with a $31 billion dollar increase in defense spending from a year earlier. Additionally, a $30 billion increase in funding for the Federal Deposit Insurance Corporation in light of the regional banking crisis last year was a major contributor to the deficit increase.
Overall, the CBO forecasts that roughly 75% of the federal deficit’s increase will be due to interest costs by 2034.

-

 Markets1 week ago
Ranked: The Largest U.S. Corporations by Number of Employees
-

 Green3 weeks ago
Ranked: Top Countries by Total Forest Loss Since 2001
-

 Money2 weeks ago
Where Does One U.S. Tax Dollar Go?
-

 Automotive2 weeks ago
Almost Every EV Stock is Down After Q1 2024
-

 AI2 weeks ago
The Stock Performance of U.S. Chipmakers So Far in 2024
-

 Markets2 weeks ago
Charted: Big Four Market Share by S&P 500 Audits
-

 Real Estate2 weeks ago
Ranked: The Most Valuable Housing Markets in America
-

 Money2 weeks ago
Which States Have the Highest Minimum Wage in America?