China
The Fastest Growing Cities in the World (2000-2016)
Thanks to drastic increases in crop yields and the falling need for manual farm labor, a mass migration towards cities started in the years following the Industrial Revolution.
This phenomenon first originated in developed economies as people moved to work in factories that produced consumer goods at a scale never before seen. Then in the 1950s, developing economies started to follow suit.
The results have been staggering, and today a country like China has at least 35 massive cities that each have an economic output comparable to entire countries.
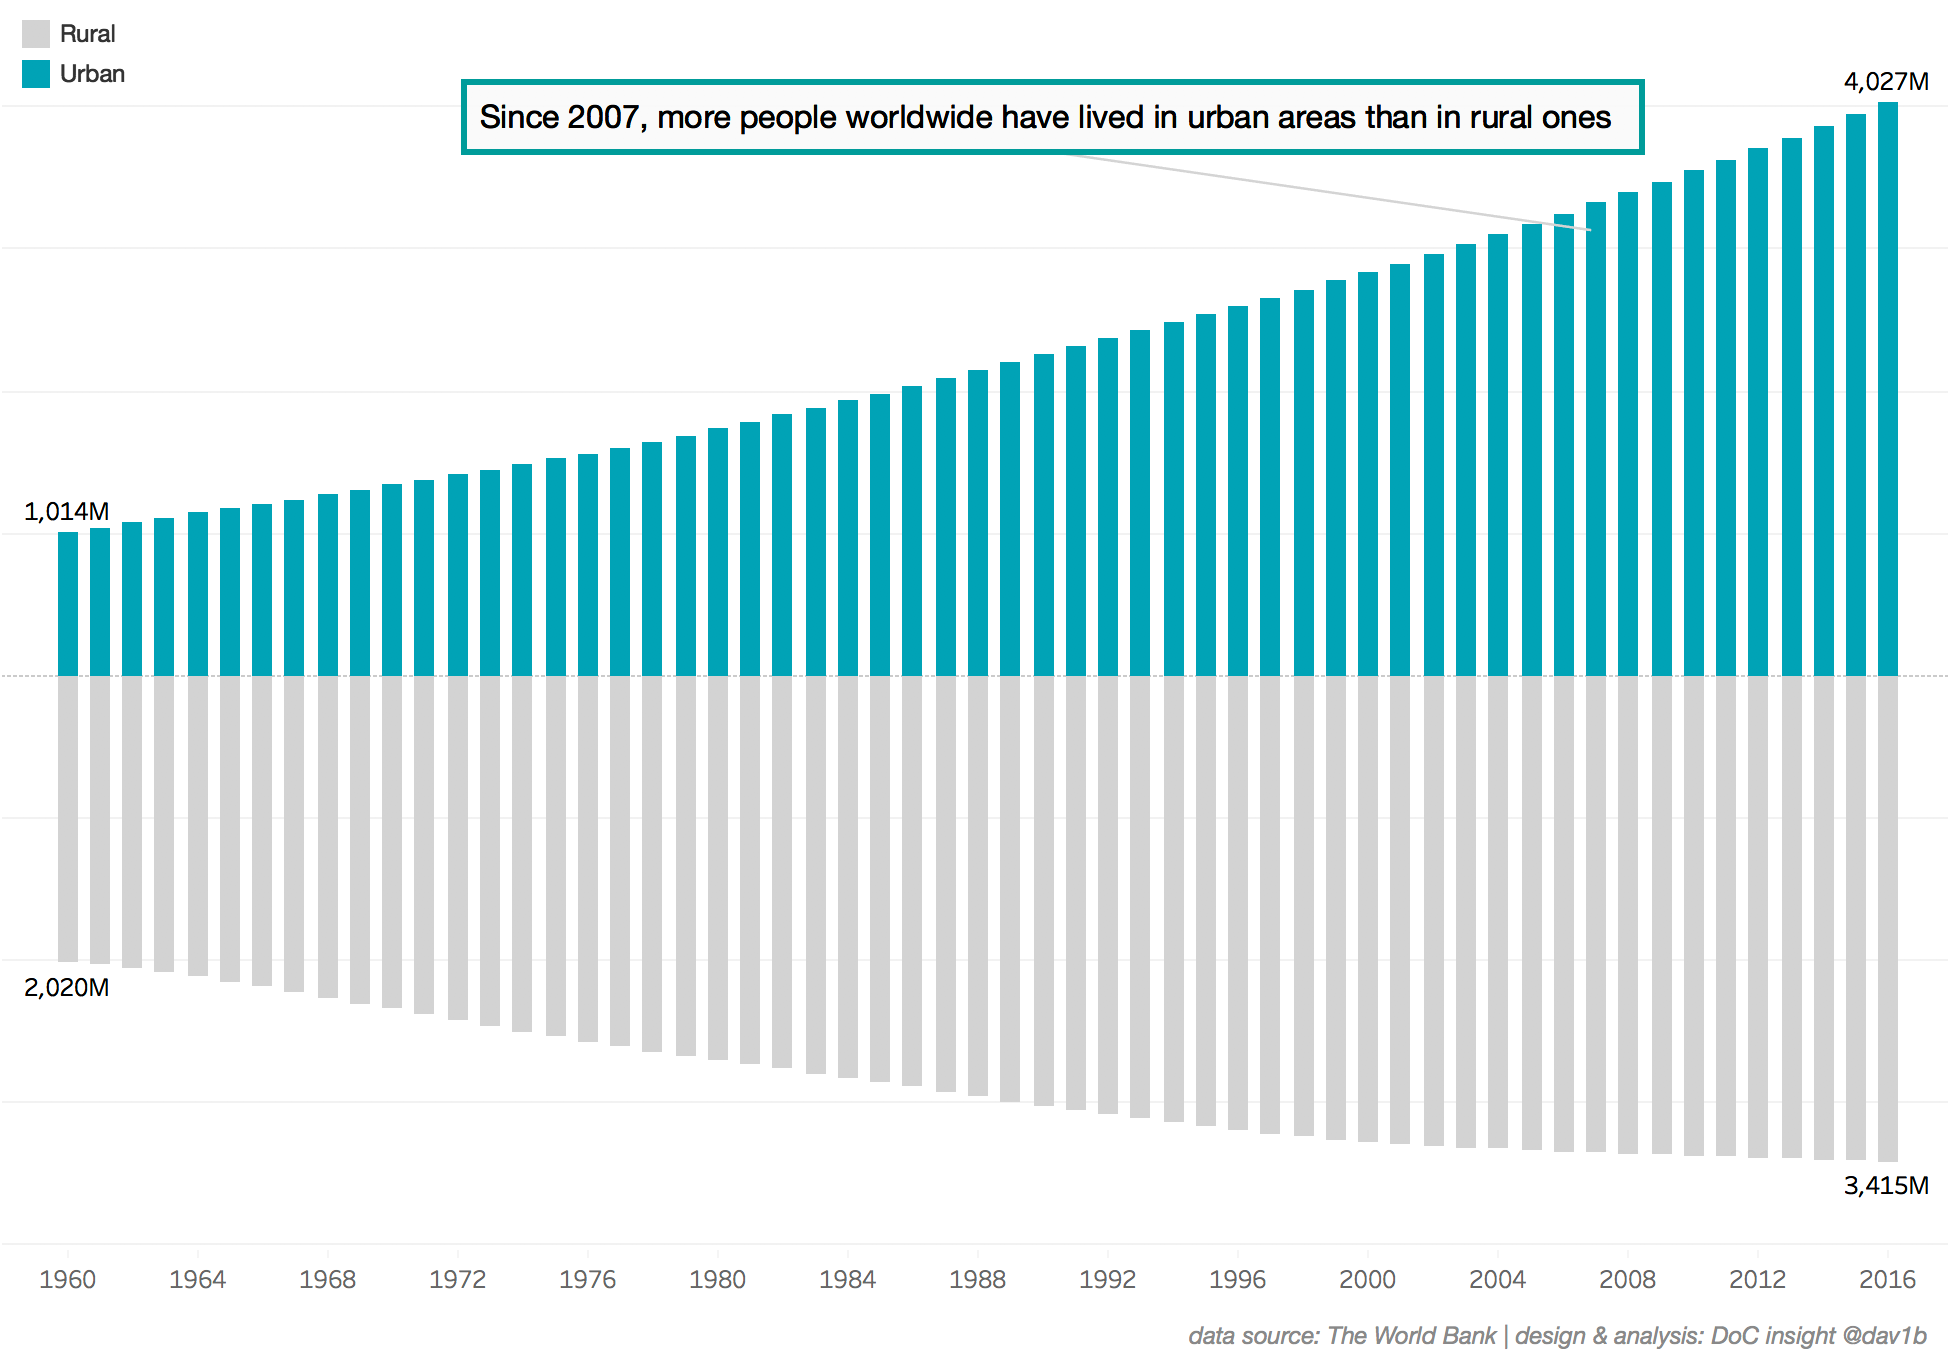
After many decades of urbanization, the portion of people living in urban areas has surpassed the total rural population. This happened in 2007, and we are now in the first window in human history in which more people are city dwellers.
So what cities are the meccas for urban migration today? And which are falling out of favor?
The Fastest Growing Cities (2000-2016)
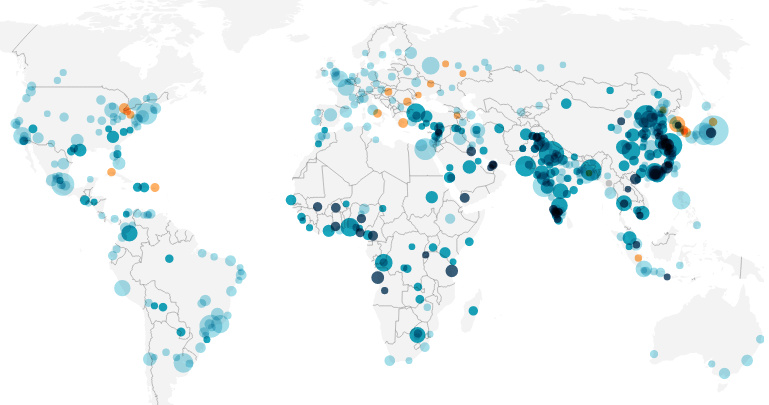
The following interactive and zoomable map was put together by Datawrapper, using data from the United Nations.
It lists 500 cities with over 1 million people, and is shaded based on annualized population growth rate between 2000 and 2016. Percent growth corresponds with darker shades of teal, while orange symbolizes negative growth over the timeframe.
It’s strongly recommended to explore the map by zooming in on particular regions. Highlighting cities themselves will give you population details for 2000 and 2016, as well as an annualized percentage growth rate.
Here are some areas we thought were worth looking at in more detail:
North America
North America is mostly what one may expect. The biggest cities (NYC, LA, Chicago, Toronto) aren’t changing too fast, while some cities in the Rust Belt (Detroit, Cleveland, Pittsburgh) have slightly negative growth rates. Austin, TX and Charlotte, NC seem to be the fastest growing cities in the U.S., overall.
South America
Colombia’s Bogotá stands out as the city in South America growing at the most blistering pace. It gained 3.6 million people in the 2000-2016 year period, good for a 2.8% annual growth rate.
China and India
These two populous countries are home to many of the dark-shaded circles on the map. It’s worth looking at an additional screenshot here (just in case if you haven’t zoomed in above).
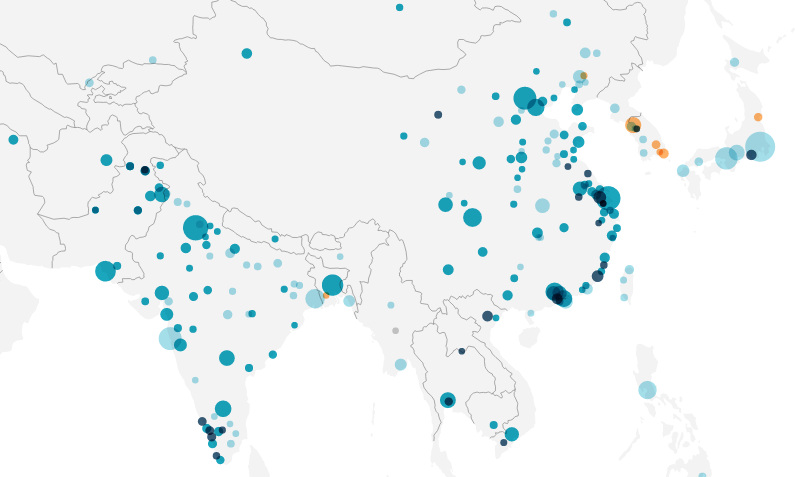
Look at the coast of China – it’s dotted with rapidly expanding cities. Incredibly, in the 16-year span of data, some of these cities have doubled in terms of population. Others like Xiamen have tripled in size. Shanghai alone has gained 10.5 million people in this span of time.
In India, the fastest growing cities are in the south, where there are at least 10 large cities that have roughly doubled in size. Delhi, which is in the north, has added nearly 11 million inhabitants over the same stretch.
Africa
In Africa, we see the names of many of the cities that are projected to be the world’s largest megacities by 2100.
Lagos in Nigeria has doubled to nearly 14 million people between 2000-2016, and it is expected to explode to 88.3 million people by 2100 to be the world’s most populous city overall. Dar es Salaam (Tanzania) and Kinshasa (DRC) are two other places that are set to grow rapidly by 2100, rounding out the list of the world’s three most populous megacities.


Markets
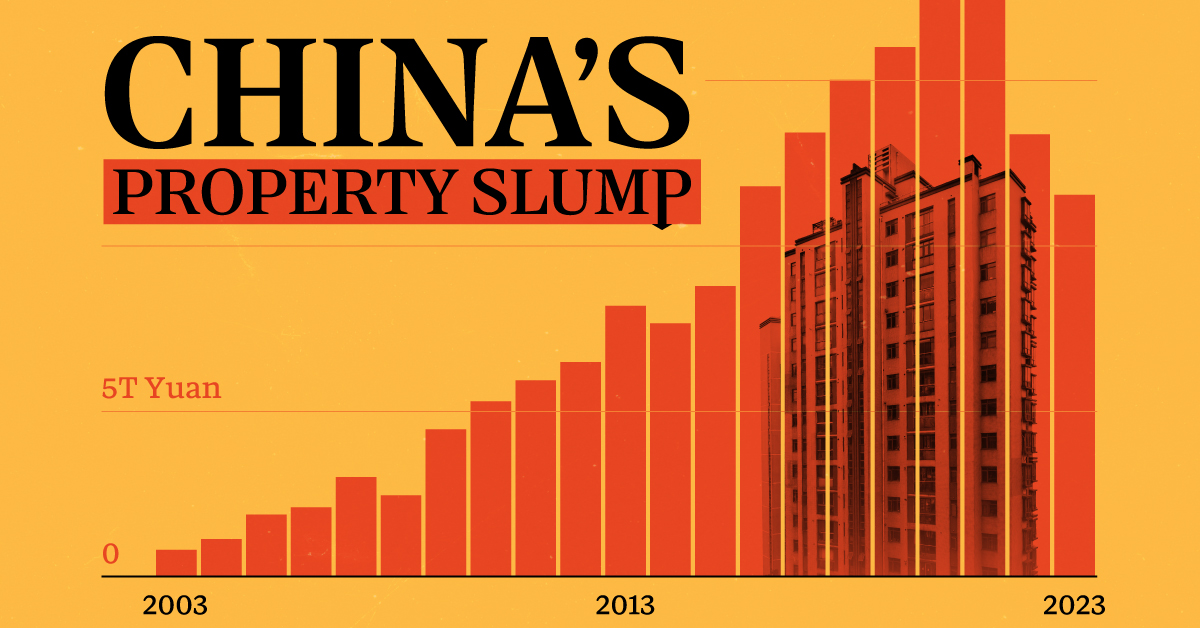
China’s Real Estate Crisis, Shown in Two Charts
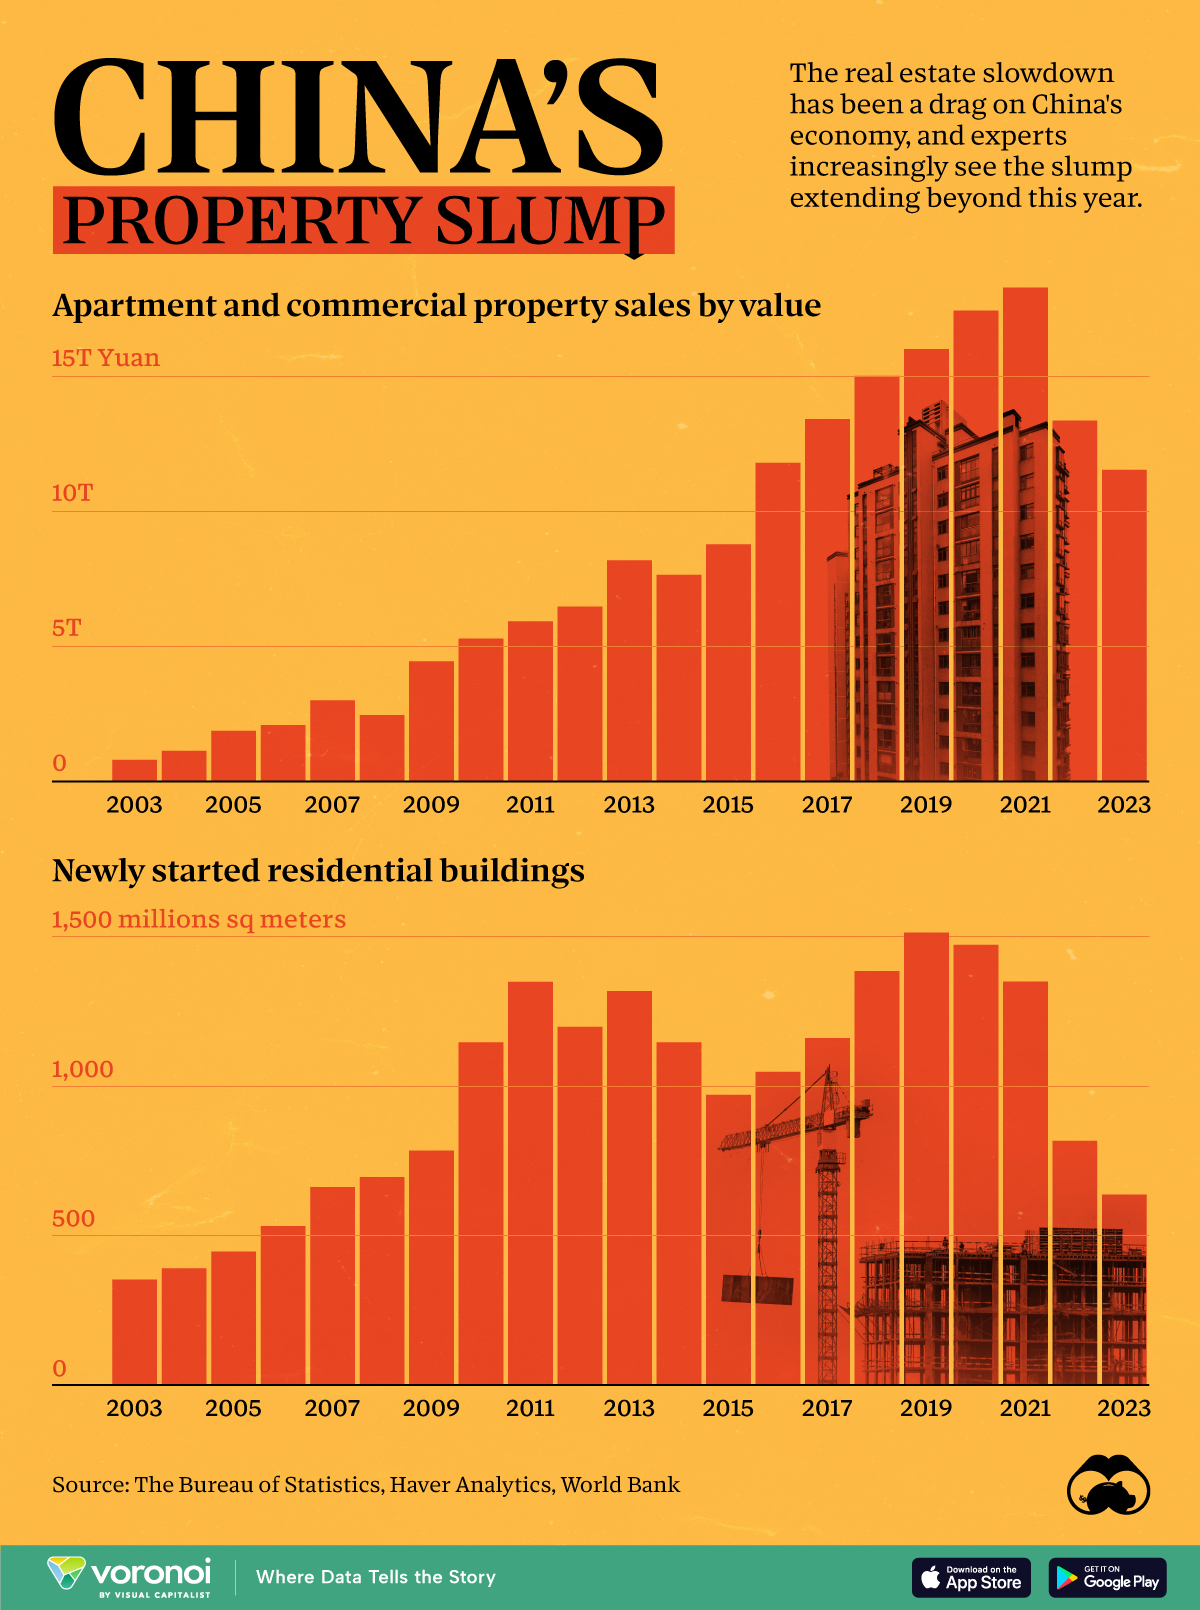
These charts show China’s real estate boom in the 21st century and the subsequent slowdown since 2022.
Visualizing China’s Real Estate Boom and Crisis
This was originally posted on our Voronoi app. Download the app for free on iOS or Android and discover incredible data-driven charts from a variety of trusted sources.
Evergrande—once China’s largest real estate developer—was forced to liquidate on January 28th. It was yet another strike against the country’s now fledgling real estate market, adding to a growing list of China’s economic worries.
In the charts above we show two annual metrics related to China’s real estate crisis from 2003 to 2023. The first looks at apartment and commercial property sales using Burreau of Statistics data from Bloomberg, and the second examines new housing starts using data from the World Bank.
Things to Know About China’s Property Slump
Property sales by value in China climbed pretty steadily from less than ¥1 trillion RMB in 2003 to over ¥15 trillion in 2021, but have since dropped to under ¥12 trillion in 2023.
This was the case across both residential and commercial sales. In China’s residential market specifically, new home sales dropped 6% in 2023, with secondhand home prices declining in major cities.
And on the development side, new residential developments have fallen 58% from 1,515 million m² in 2019 to 637 million m² in 2023.
| Year | New Residential Building Developments (million sq meters) |
|---|---|
| 2023 | 637.4 |
| 2022 | 817.3 |
| 2021 | 1,350.2 |
| 2020 | 1,473.4 |
| 2019 | 1,514.5 |
| 2018 | 1,385.4 |
| 2017 | 1,160.9 |
| 2016 | 1,047.8 |
| 2015 | 970.8 |
| 2014 | 1,146.4 |
| 2013 | 1,318.5 |
| 2012 | 1,199.1 |
| 2011 | 1,349.4 |
| 2010 | 1,147.2 |
| 2009 | 784.9 |
| 2008 | 695.4 |
| 2007 | 662.3 |
| 2006 | 531.8 |
| 2005 | 446.5 |
| 2004 | 390.0 |
| 2003 | 352.4 |
| 2002 | 276.5 |
Here are a few more things to know about the ongoing real estate crisis in China:
- Developer Defaults: Real estate firms faced $125 billion in bond defaults between 2020 and 2023.
- Economic Impact: The property sector’s slump has dragged down China’s economy, leading to layoffs and financial instability.
- Getting Creative: Municipalities, many of which rely on land sales as a key source of income, have been introducing “old-for-new” support measures meant to stimulate new home purchases.
Experts predict a prolonged downturn, with many people souring on Chinese investments, but exactly how things will develop after Evergrande’s collapse is unclear.

-

 Mining2 weeks ago
Charted: The Value Gap Between the Gold Price and Gold Miners
-

 Real Estate1 week ago
Ranked: The Most Valuable Housing Markets in America
-

 Business1 week ago
Charted: Big Four Market Share by S&P 500 Audits
-

 AI1 week ago
The Stock Performance of U.S. Chipmakers So Far in 2024
-

 Misc1 week ago
Almost Every EV Stock is Down After Q1 2024
-

 Money2 weeks ago
Where Does One U.S. Tax Dollar Go?
-

 Green2 weeks ago
Ranked: Top Countries by Total Forest Loss Since 2001
-

 Real Estate2 weeks ago
Visualizing America’s Shortage of Affordable Homes