Energy
Experts are Hilariously Bad at Forecasting Solar Installations
For the latest data on the world’s energy markets, organizations such as the IEA (International Energy Agency) and the EIA (Energy Information Administration) are crucial sources. Every year, investors and entire industries rely on their reporting on energy supply and demand, as well as their forecasts going forward.
However, these organizations tend to be better at some things than others. For example, in terms of summing up past and current data on what is going on in the world, they generally do a pretty good job. We referenced their numbers when we looked at the changing anatomy of U.S. oil imports, or when showing the decline in coal use over recent years.
In other situations, such as trying to extrapolate numbers on current trends or predicting the tipping point of technologies, things get a bit dicier. Forecasting the roll-out of solar, in particular, has proved to be a daunting challenge for these organizations over the years.
Global Solar Installations
Before we dive in, we should make one thing clear: it’s notoriously difficult to make these types of predictions, and we do not envy the position of these researchers in any sense.
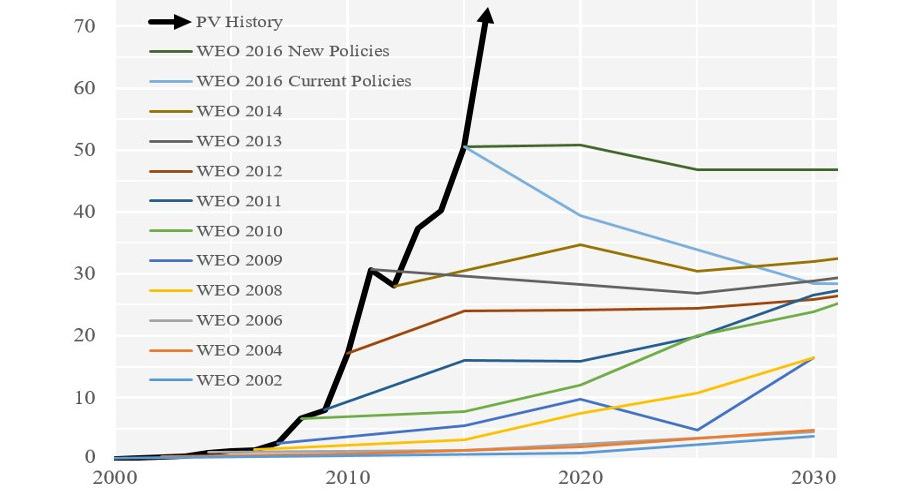
That being said, as shown in this chart from Auke Hoekstra, forecasts for annual global solar installations by the IEA have been egregiously bad for over a decade.
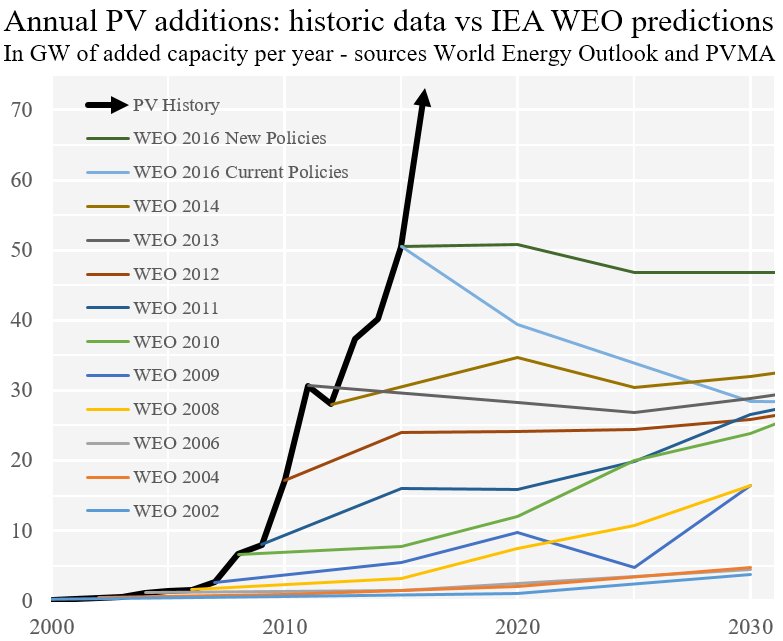
Forecasts from the IEA are pulled from their World Energy Outlook (WEO) reports, which are published each year. Meanwhile, the “PV History” line above is the actual data for photovoltaic (PV) installations each year.
Again, it’s extremely difficult to make such forecasts, and these organizations tend to be conservative with their outlooks. However, it’s pretty evident that they’ve missed a pretty significant trend here.
U.S. Solar Installations
Maybe the U.S. government can do better?
Here’s a look at forecasts by the EIA for annual energy production from solar in the U.S. over many decades, courtesy of Steffen Christensen:
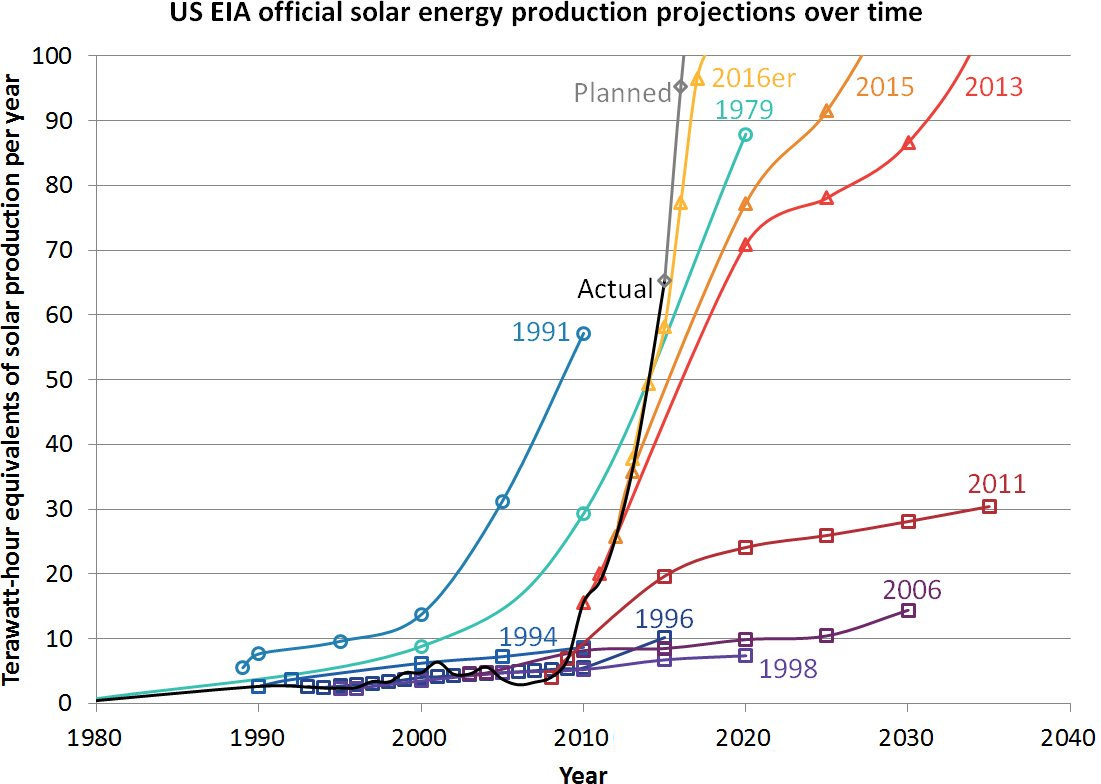
This one’s more interesting. Instead of counting out solar each and every year, the EIA has had changing attitudes towards solar over time.
The projection from 1979 seems to actually be the most accurate – but the ones from 1994-2011 skip any premise of a solar boom entirely. As we get closer to present day, forecasts get more accurate, but are still too conservative (2013, 2015).
Hindsight is 20/20
It’s easy for us to be armchair critics, but it is not fair to rag on these organizations too much.
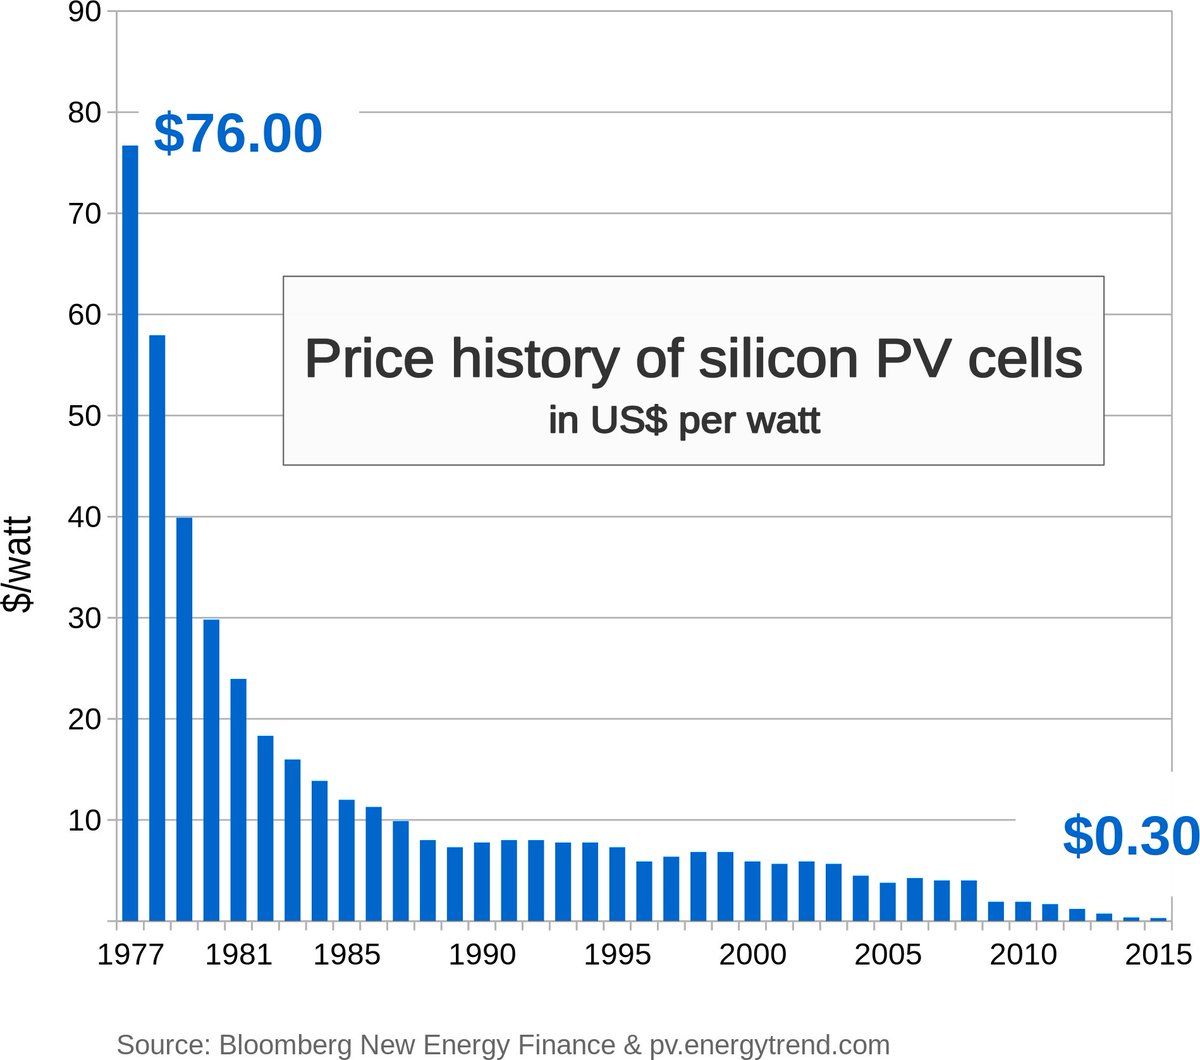
Here’s the trend they missed that made all the difference:
Curious to see how other people have fared in making predictions on technology throughout history?
Here’s a timeline of failed tech predictions that will humble any forecaster.


Lithium
Ranked: The Top 10 EV Battery Manufacturers in 2023
Asia dominates this ranking of the world’s largest EV battery manufacturers in 2023.


The Top 10 EV Battery Manufacturers in 2023
This was originally posted on our Voronoi app. Download the app for free on iOS or Android and discover incredible data-driven charts from a variety of trusted sources.
Despite efforts from the U.S. and EU to secure local domestic supply, all major EV battery manufacturers remain based in Asia.
In this graphic we rank the top 10 EV battery manufacturers by total battery deployment (measured in megawatt-hours) in 2023. The data is from EV Volumes.
Chinese Dominance
Contemporary Amperex Technology Co. Limited (CATL) has swiftly risen in less than a decade to claim the title of the largest global battery group.
The Chinese company now has a 34% share of the market and supplies batteries to a range of made-in-China vehicles, including the Tesla Model Y, SAIC’s MG4/Mulan, and various Li Auto models.
| Company | Country | 2023 Production (megawatt-hour) | Share of Total Production |
|---|---|---|---|
| CATL | 🇨🇳 China | 242,700 | 34% |
| BYD | 🇨🇳 China | 115,917 | 16% |
| LG Energy Solution | 🇰🇷 Korea | 108,487 | 15% |
| Panasonic | 🇯🇵 Japan | 56,560 | 8% |
| SK On | 🇰🇷 Korea | 40,711 | 6% |
| Samsung SDI | 🇰🇷 Korea | 35,703 | 5% |
| CALB | 🇨🇳 China | 23,493 | 3% |
| Farasis Energy | 🇨🇳 China | 16,527 | 2% |
| Envision AESC | 🇨🇳 China | 8,342 | 1% |
| Sunwoda | 🇨🇳 China | 6,979 | 1% |
| Other | - | 56,040 | 8% |
In 2023, BYD surpassed LG Energy Solution to claim second place. This was driven by demand from its own models and growth in third-party deals, including providing batteries for the made-in-Germany Tesla Model Y, Toyota bZ3, Changan UNI-V, Venucia V-Online, as well as several Haval and FAW models.
The top three battery makers (CATL, BYD, LG) collectively account for two-thirds (66%) of total battery deployment.
Once a leader in the EV battery business, Panasonic now holds the fourth position with an 8% market share, down from 9% last year. With its main client, Tesla, now sourcing batteries from multiple suppliers, the Japanese battery maker seems to be losing its competitive edge in the industry.
Overall, the global EV battery market size is projected to grow from $49 billion in 2022 to $98 billion by 2029, according to Fortune Business Insights.

-

 Travel1 week ago
Airline Incidents: How Do Boeing and Airbus Compare?
-

 Markets3 weeks ago
Visualizing America’s Shortage of Affordable Homes
-

 Green3 weeks ago
Ranked: Top Countries by Total Forest Loss Since 2001
-

 Money2 weeks ago
Where Does One U.S. Tax Dollar Go?
-

 Misc2 weeks ago
Almost Every EV Stock is Down After Q1 2024
-

 AI2 weeks ago
The Stock Performance of U.S. Chipmakers So Far in 2024
-

 Markets2 weeks ago
Charted: Big Four Market Share by S&P 500 Audits
-

 Real Estate2 weeks ago
Ranked: The Most Valuable Housing Markets in America