Technology
Visualizing the Evolution of Global Advertising Spend (1980-2020)
The Evolution of Global Advertising Spend (1980-2020)
Marketers may still “sell the sizzle” and not the steak, but shifts in the media landscape and consumer behavior mean that advertisers must constantly adapt their media strategies.
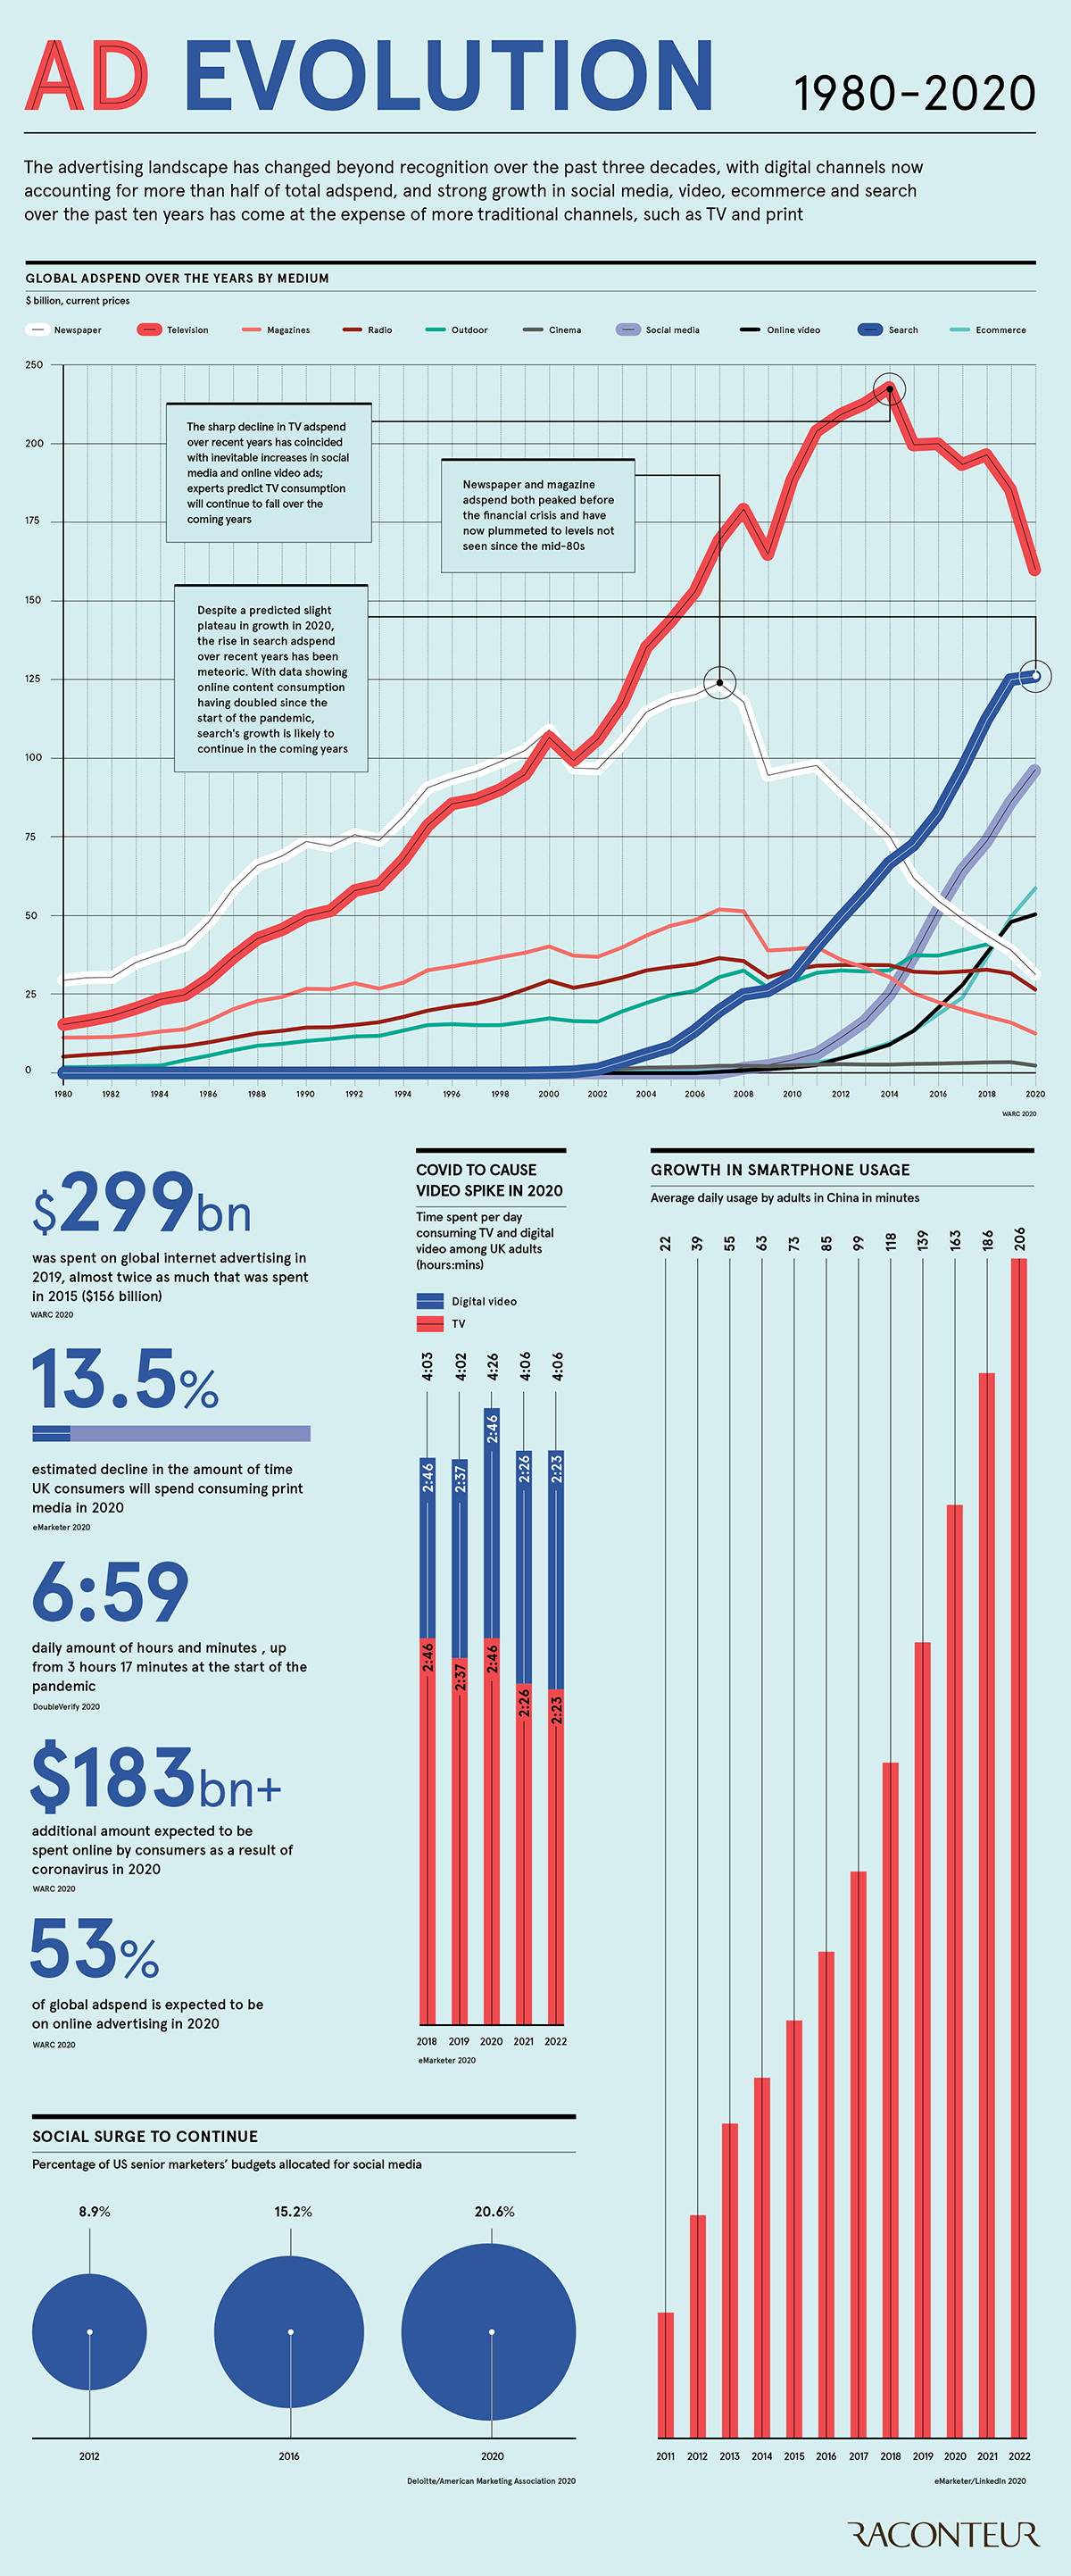
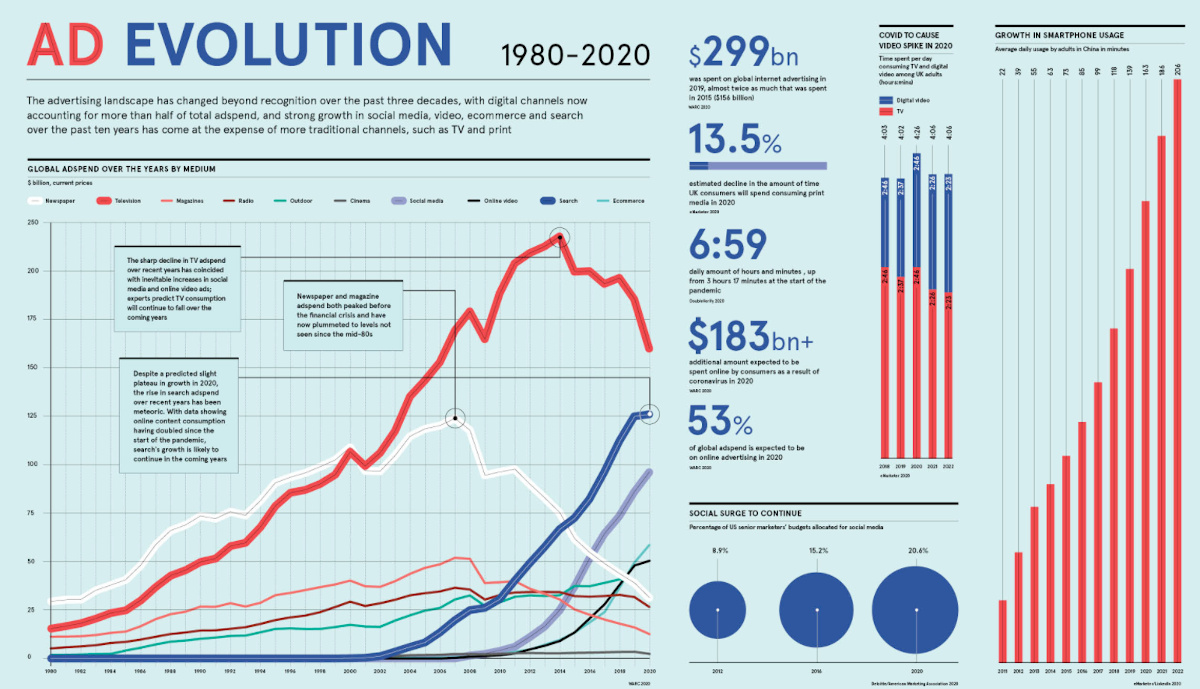
In the above infographic from Raconteur, we can take a closer look at how global advertising spend has evolved over recent decades across the media sphere.
The Media Landscape Shapes the Ad World
In advertising, dollars go where the eyeballs are.
Recently, all eyes have been on the digital realm—a trend that coincided with the disastrous fall of the print industry. As people mass-migrated to digital platforms in the 2010s, marketers were hot on their heels, and the fall of print media began.
In 2014, TV ad spend met a similar fate, peaking at nearly $250 billion. However, despite its rather sharp decline, TV still remains the largest in terms of global advertising spending.
The demise of the newspaper is shown dramatically in the above graphic, beginning in 2007 before the financial crisis, and correlating with the ascent of search engine ad spend. Peaking at $125 billion before the social media boom, newspaper advertising has never recovered.
Winners in a Digital World
In less than five years, internet ad spend nearly doubled: $299 billion was spent on global internet advertising in 2019 compared to $156 billion in 2015.
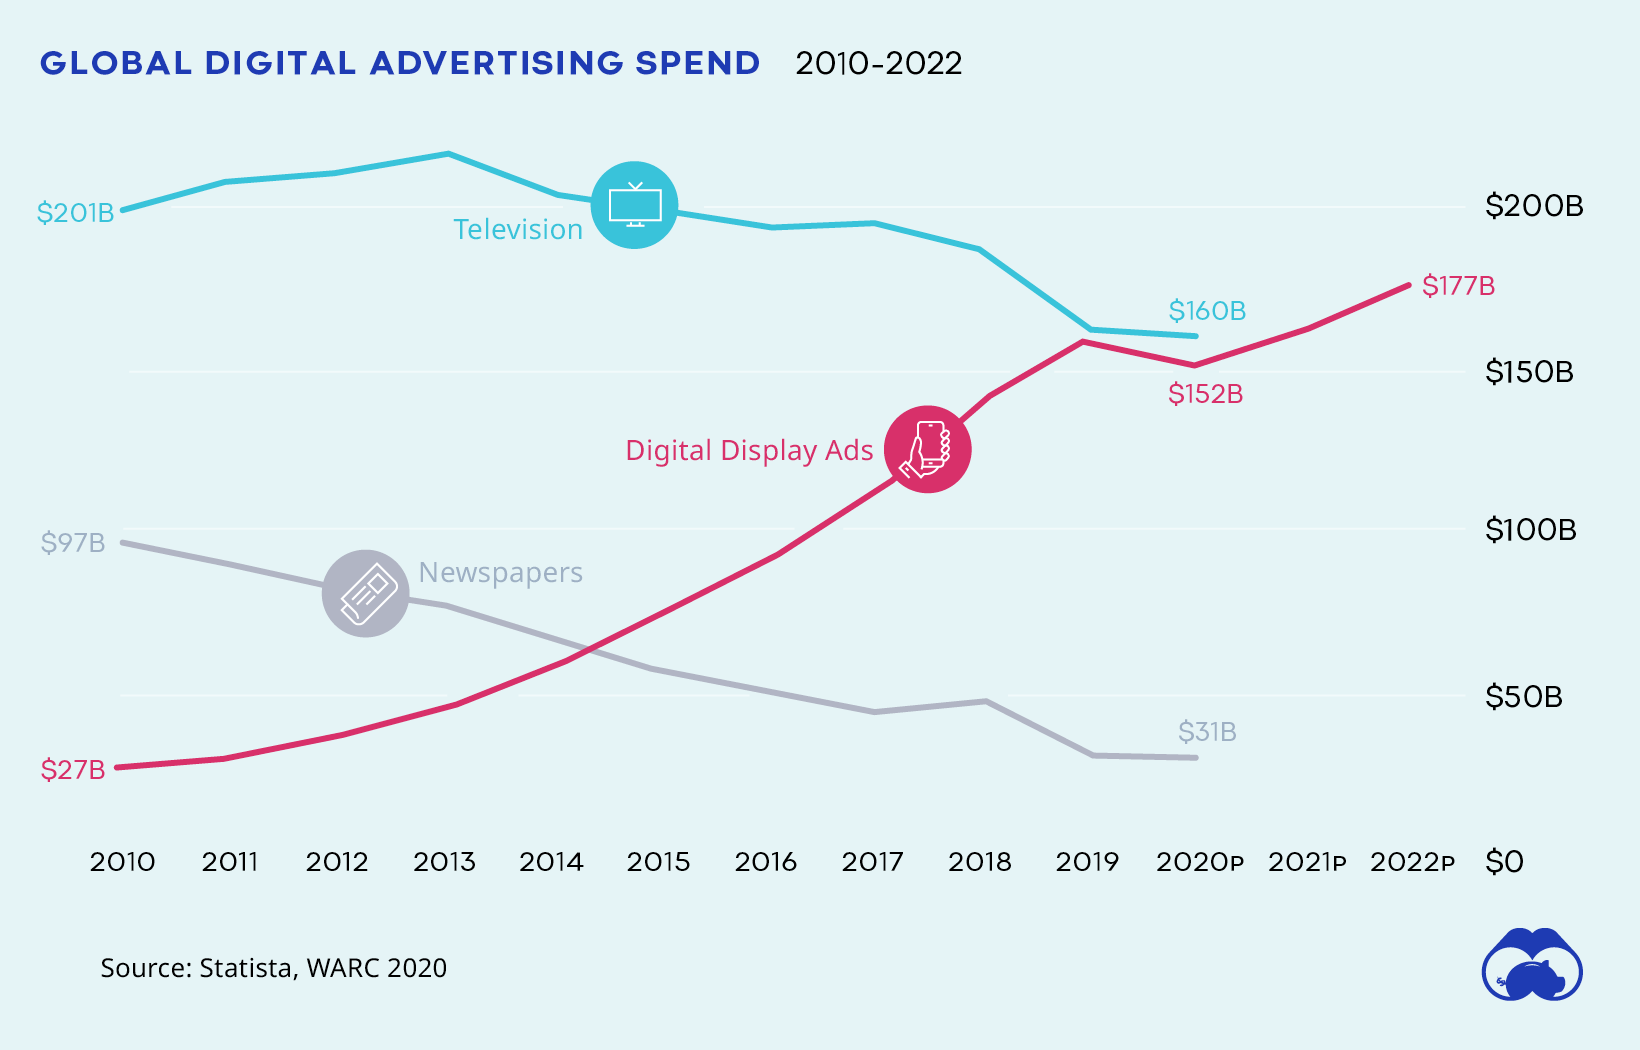
Reaching $160 billion in one year, digital display advertising—a broad category including banner ads, rich media, advertorial and sponsorship, online video and social media—accounted for the largest global ad expenditure in 2019.
Comparing all digital display ad spend in isolation with TV and newspaper, we can see the continued significance of the shift to digital, and how it’s projected to continue.
Looking at the main visualization, it’s clear that budgets have shifted, with digital channels now accounting for more than half of total advertising spend.
Although digital spending is up across the board, search engine ad spend began to plateau in the late 2010s, while social and ecommerce mediums both continue to rise. Impressively, between 2012 to 2020, the percentage of U.S. senior marketing budgets allocated to social media more than doubled, ballooning from almost 9% to nearly 21%.
“People share, read and generally engage more with any type of content when it’s surfaced through friends and people they know and trust”
– Malorie Lucich, Head of Product & Tech Communications, Pinterest
Advertisers aren’t the only ones spending money online. More than $183 billion is expected to be spent online by consumers as a result of the 2020 pandemic.
Screen Life: Time is Ad Money
It’s not only that people have shifted their focus from analog to digital. They are also spending many of their waking hours in front of a screen.
- Adults in the U.S. spend an average of 11 hours a day in front of a screen, and the ad dollars that vie for our digital attention are also rising.
- Globally, the daily average of time spent online was almost 7 hours during the pandemic, up from 3.2 hours at the beginning of lockdowns.
As a result of COVID-19 lifestyle shifts, time spent watching digital video is expected to increase. According to eMarketer, digital video spiked among UK adults during the pandemic—to 2.75 hours, and almost by 30 minutes daily in total video and TV screen time.
Smartphone Boom: From Big Screens to Small
Social media and digital ad spend also corresponds with a steady uptick in global smartphone ownership and usage.
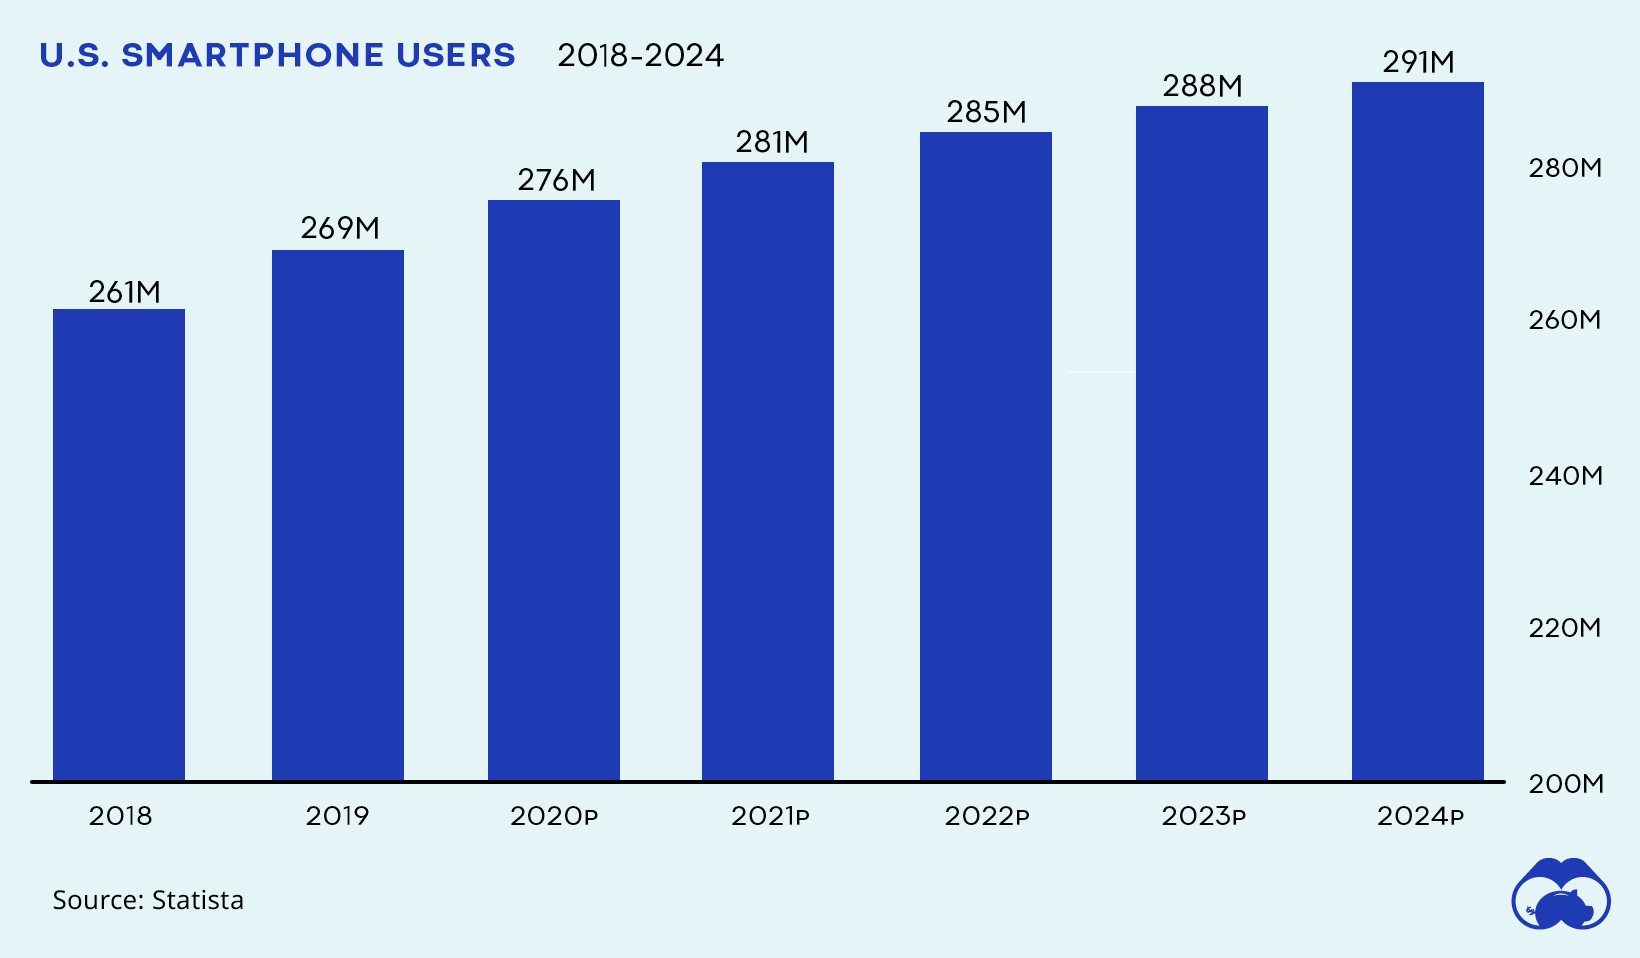
In February of 2019, for instance, 81% of U.S. residents owned a smartphone. By 2024, it’s expected that 291 million Americans (almost 90%) will be using a smartphone.
In China, smartphone usage has almost doubled in 5 years—and is predicted to surpass 3.4 hours a day by 2022. Statista estimates there will be 1.13 billion smartphone users in China by 2025, making up nearly 14% of the world’s population by 2025.
As billions of users spend hundreds of hours with their small screens every year, it’s possible that mobile-based ad spend—including uber-popular apps like TikTok—will become even more commonplace.
The Digital Future is Now
As a result of the pandemic, it is projected that global advertising spending could fall by 8.1% this year. However, 53% of all global ad spend is expected to flow online. And the rise of search, social media, video, ecommerce—in contrast to TV and print—becomes clearer.
Although search ad spend recently plateaued, its rise over the last decade has been dramatic. With digital content consumption doubling since the pandemic began, the growth of social, e-commerce, and search ad spend are likely to continue.
If these trajectories are any indication, advertising budgets will only be getting more digital.


Technology
Ranked: Semiconductor Companies by Industry Revenue Share
Nvidia is coming for Intel’s crown. Samsung is losing ground. AI is transforming the space. We break down revenue for semiconductor companies.


Semiconductor Companies by Industry Revenue Share
This was originally posted on our Voronoi app. Download the app for free on Apple or Android and discover incredible data-driven charts from a variety of trusted sources.
Did you know that some computer chips are now retailing for the price of a new BMW?
As computers invade nearly every sphere of life, so too have the chips that power them, raising the revenues of the businesses dedicated to designing them.
But how did various chipmakers measure against each other last year?
We rank the biggest semiconductor companies by their percentage share of the industry’s revenues in 2023, using data from Omdia research.
Which Chip Company Made the Most Money in 2023?
Market leader and industry-defining veteran Intel still holds the crown for the most revenue in the sector, crossing $50 billion in 2023, or 10% of the broader industry’s topline.
All is not well at Intel, however, with the company’s stock price down over 20% year-to-date after it revealed billion-dollar losses in its foundry business.
| Rank | Company | 2023 Revenue | % of Industry Revenue |
|---|---|---|---|
| 1 | Intel | $51B | 9.4% |
| 2 | NVIDIA | $49B | 9.0% |
| 3 | Samsung Electronics | $44B | 8.1% |
| 4 | Qualcomm | $31B | 5.7% |
| 5 | Broadcom | $28B | 5.2% |
| 6 | SK Hynix | $24B | 4.4% |
| 7 | AMD | $22B | 4.1% |
| 8 | Apple | $19B | 3.4% |
| 9 | Infineon Tech | $17B | 3.2% |
| 10 | STMicroelectronics | $17B | 3.2% |
| 11 | Texas Instruments | $17B | 3.1% |
| 12 | Micron Technology | $16B | 2.9% |
| 13 | MediaTek | $14B | 2.6% |
| 14 | NXP | $13B | 2.4% |
| 15 | Analog Devices | $12B | 2.2% |
| 16 | Renesas Electronics Corporation | $11B | 1.9% |
| 17 | Sony Semiconductor Solutions Corporation | $10B | 1.9% |
| 18 | Microchip Technology | $8B | 1.5% |
| 19 | Onsemi | $8B | 1.4% |
| 20 | KIOXIA Corporation | $7B | 1.3% |
| N/A | Others | $126B | 23.2% |
| N/A | Total | $545B | 100% |
Note: Figures are rounded. Totals and percentages may not sum to 100.
Meanwhile, Nvidia is very close to overtaking Intel, after declaring $49 billion of topline revenue for 2023. This is more than double its 2022 revenue ($21 billion), increasing its share of industry revenues to 9%.
Nvidia’s meteoric rise has gotten a huge thumbs-up from investors. It became a trillion dollar stock last year, and broke the single-day gain record for market capitalization this year.
Other chipmakers haven’t been as successful. Out of the top 20 semiconductor companies by revenue, 12 did not match their 2022 revenues, including big names like Intel, Samsung, and AMD.
The Many Different Types of Chipmakers
All of these companies may belong to the same industry, but they don’t focus on the same niche.
According to Investopedia, there are four major types of chips, depending on their functionality: microprocessors, memory chips, standard chips, and complex systems on a chip.
Nvidia’s core business was once GPUs for computers (graphics processing units), but in recent years this has drastically shifted towards microprocessors for analytics and AI.
These specialized chips seem to be where the majority of growth is occurring within the sector. For example, companies that are largely in the memory segment—Samsung, SK Hynix, and Micron Technology—saw peak revenues in the mid-2010s.

-

 Technology2 weeks ago
Ranked: The Most Popular Smartphone Brands in the U.S.
-

 Automotive1 week ago
Almost Every EV Stock is Down After Q1 2024
-

 Money1 week ago
Where Does One U.S. Tax Dollar Go?
-

 Green2 weeks ago
Ranked: Top Countries by Total Forest Loss Since 2001
-

 Real Estate2 weeks ago
Visualizing America’s Shortage of Affordable Homes
-

 Maps2 weeks ago
Mapped: Average Wages Across Europe
-

 Mining2 weeks ago
Charted: The Value Gap Between the Gold Price and Gold Miners
-

 Demographics2 weeks ago
Visualizing the Size of the Global Senior Population