Markets
What is the Difference Between the NYSE and Nasdaq?
The NYSE and Nasdaq exchanges are worth more than $35 trillion in market capitalization, making up a sizable portion of the global equities market.
However, while they are both large American stock exchanges containing listings that are household names, they are also very different in how they work.
Comparing the NYSE and Nasdaq Exchanges
Today’s infographic from StocksToTrade.com explains the major differences between these two exchanges.
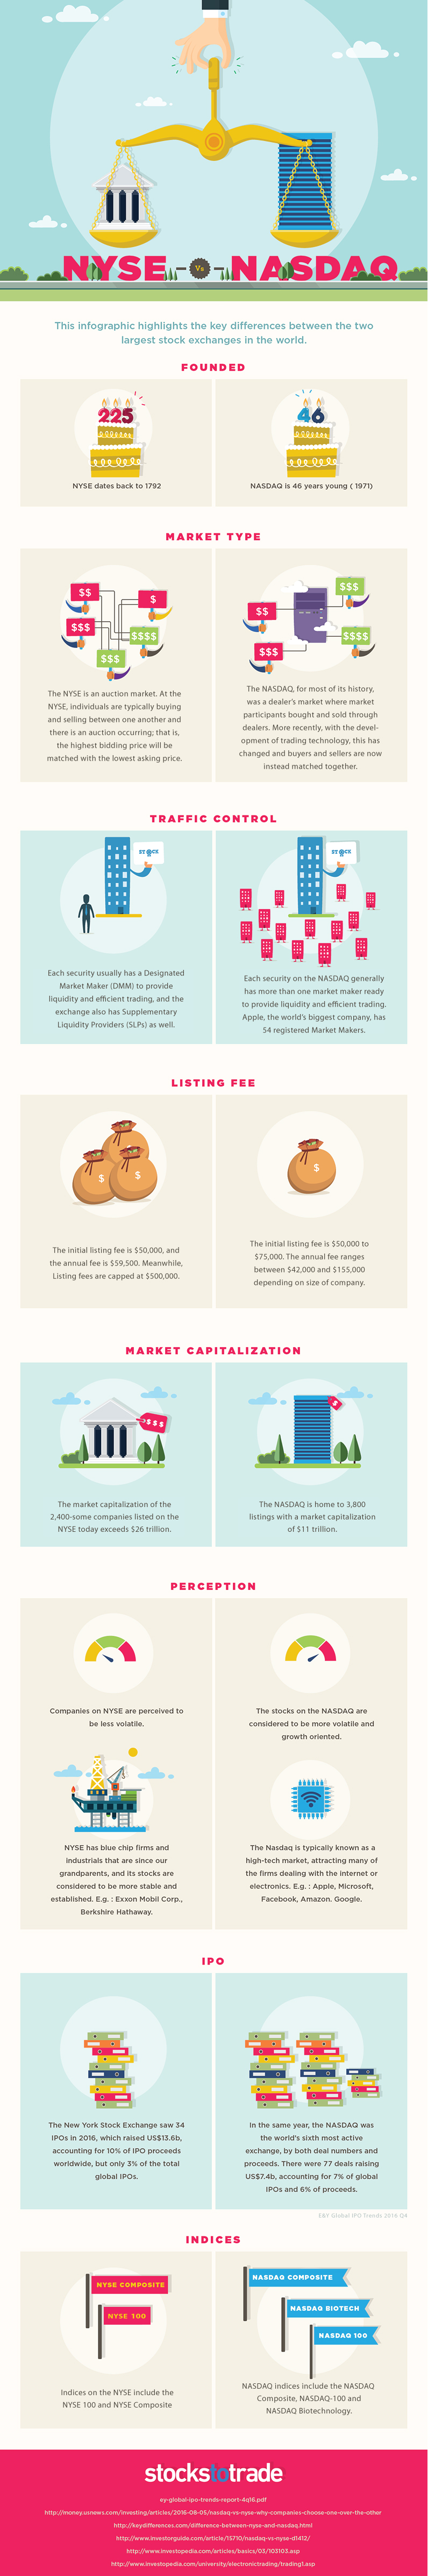
The NYSE and Nasdaq have significant differences, including the size and number of listings, how trades are made, and also how they are perceived by investors.
Size and Number of Listings
By the value of listed companies, the NYSE and Nasdaq are the two largest exchanges in the world.
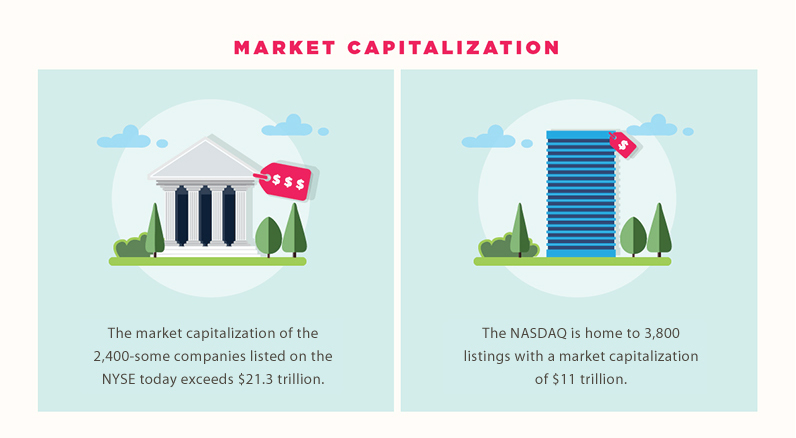
The NYSE has over 2,400 companies that combine for $26 trillion in market capitalization. It’s also home to many of the big “blue chip” companies that have existed for decades, like Walmart, Exxon Mobil, or General Electric. This is partly because the exchange has existed since 1792.
Meanwhile, the Nasdaq has more companies than the NYSE, but has a wider spectrum in terms of the size of companies. Of course, the exchange is known for having the large tech-focused companies like Facebook, Google, and Amazon, but there are many smaller listings on the Nasdaq as well. In fact, there are around 1,200 smaller securities listed on the 46-year-old exchange with market caps of $200 million or less.
In total, there are over 3,800 companies listed on the Nasdaq, worth a total of $11 trillion in market capitalization.
Operational Differences
Aside from the obvious differences in the size and types of listings, the NYSE and Nasdaq also have significant operational differences.
The largest difference in the past was that the NYSE market was an auction market, while the Nasdaq was considered a dealer market. In the former, the highest bid for a stock is matched with the lowest asking price. In the latter, buying and selling happens in split seconds electronically through dealers. This difference has since changed as a result of trading technology, and both markets effectively connect buyers and sellers instantaneously in similar ways at the best price.
The Nasdaq has multiple market makers per stock – and some, like Apple even have 54 such registered makers. Meanwhile, the NYSE usually has one Designated Market Maker (DMM) per stock that ensures a fair and orderly market in that security. The NYSE also uses Supplementary Liquidity Providers (SLPs) as well.
Different Perspectives
For various reasons, both stocks are seen a little differently by investors, as well.
The NYSE is seen as the stock market for “tried and true” securities that have been, and will continue to be, the mainstays of the financial world for decades.
The Nasdaq, on the other hand, is seen as a place for growth-oriented tech stocks. It was where the action was in the Dotcom boom and bust, and it’s the place where the world’s largest tech stocks are listed today.


Markets
U.S. Debt Interest Payments Reach $1 Trillion
U.S. debt interest payments have surged past the $1 trillion dollar mark, amid high interest rates and an ever-expanding debt burden.


U.S. Debt Interest Payments Reach $1 Trillion
This was originally posted on our Voronoi app. Download the app for free on iOS or Android and discover incredible data-driven charts from a variety of trusted sources.
The cost of paying for America’s national debt crossed the $1 trillion dollar mark in 2023, driven by high interest rates and a record $34 trillion mountain of debt.
Over the last decade, U.S. debt interest payments have more than doubled amid vast government spending during the pandemic crisis. As debt payments continue to soar, the Congressional Budget Office (CBO) reported that debt servicing costs surpassed defense spending for the first time ever this year.
This graphic shows the sharp rise in U.S. debt payments, based on data from the Federal Reserve.
A $1 Trillion Interest Bill, and Growing
Below, we show how U.S. debt interest payments have risen at a faster pace than at another time in modern history:
| Date | Interest Payments | U.S. National Debt |
|---|---|---|
| 2023 | $1.0T | $34.0T |
| 2022 | $830B | $31.4T |
| 2021 | $612B | $29.6T |
| 2020 | $518B | $27.7T |
| 2019 | $564B | $23.2T |
| 2018 | $571B | $22.0T |
| 2017 | $493B | $20.5T |
| 2016 | $460B | $20.0T |
| 2015 | $435B | $18.9T |
| 2014 | $442B | $18.1T |
| 2013 | $425B | $17.2T |
| 2012 | $417B | $16.4T |
| 2011 | $433B | $15.2T |
| 2010 | $400B | $14.0T |
| 2009 | $354B | $12.3T |
| 2008 | $380B | $10.7T |
| 2007 | $414B | $9.2T |
| 2006 | $387B | $8.7T |
| 2005 | $355B | $8.2T |
| 2004 | $318B | $7.6T |
| 2003 | $294B | $7.0T |
| 2002 | $298B | $6.4T |
| 2001 | $318B | $5.9T |
| 2000 | $353B | $5.7T |
| 1999 | $353B | $5.8T |
| 1998 | $360B | $5.6T |
| 1997 | $368B | $5.5T |
| 1996 | $362B | $5.3T |
| 1995 | $357B | $5.0T |
| 1994 | $334B | $4.8T |
| 1993 | $311B | $4.5T |
| 1992 | $306B | $4.2T |
| 1991 | $308B | $3.8T |
| 1990 | $298B | $3.4T |
| 1989 | $275B | $3.0T |
| 1988 | $254B | $2.7T |
| 1987 | $240B | $2.4T |
| 1986 | $225B | $2.2T |
| 1985 | $219B | $1.9T |
| 1984 | $205B | $1.7T |
| 1983 | $176B | $1.4T |
| 1982 | $157B | $1.2T |
| 1981 | $142B | $1.0T |
| 1980 | $113B | $930.2B |
| 1979 | $96B | $845.1B |
| 1978 | $84B | $789.2B |
| 1977 | $69B | $718.9B |
| 1976 | $61B | $653.5B |
| 1975 | $55B | $576.6B |
| 1974 | $50B | $492.7B |
| 1973 | $45B | $469.1B |
| 1972 | $39B | $448.5B |
| 1971 | $36B | $424.1B |
| 1970 | $35B | $389.2B |
| 1969 | $30B | $368.2B |
| 1968 | $25B | $358.0B |
| 1967 | $23B | $344.7B |
| 1966 | $21B | $329.3B |
Interest payments represent seasonally adjusted annual rate at the end of Q4.
At current rates, the U.S. national debt is growing by a remarkable $1 trillion about every 100 days, equal to roughly $3.6 trillion per year.
As the national debt has ballooned, debt payments even exceeded Medicaid outlays in 2023—one of the government’s largest expenditures. On average, the U.S. spent more than $2 billion per day on interest costs last year. Going further, the U.S. government is projected to spend a historic $12.4 trillion on interest payments over the next decade, averaging about $37,100 per American.
Exacerbating matters is that the U.S. is running a steep deficit, which stood at $1.1 trillion for the first six months of fiscal 2024. This has accelerated due to the 43% increase in debt servicing costs along with a $31 billion dollar increase in defense spending from a year earlier. Additionally, a $30 billion increase in funding for the Federal Deposit Insurance Corporation in light of the regional banking crisis last year was a major contributor to the deficit increase.
Overall, the CBO forecasts that roughly 75% of the federal deficit’s increase will be due to interest costs by 2034.

-

 Green1 week ago
Ranked: The Countries With the Most Air Pollution in 2023
-

 Misc2 weeks ago
Almost Every EV Stock is Down After Q1 2024
-

 AI2 weeks ago
The Stock Performance of U.S. Chipmakers So Far in 2024
-

 Markets2 weeks ago
Charted: Big Four Market Share by S&P 500 Audits
-

 Real Estate2 weeks ago
Ranked: The Most Valuable Housing Markets in America
-

 Money2 weeks ago
Which States Have the Highest Minimum Wage in America?
-

 AI2 weeks ago
Ranked: Semiconductor Companies by Industry Revenue Share
-

 Travel2 weeks ago
Ranked: The World’s Top Flight Routes, by Revenue