Energy
The Critical Ingredients Needed to Fuel the Battery Boom
The Battery Series
Part 4: Critical Ingredients Needed to Fuel the Battery Boom
The Battery Series is a five-part infographic series that explores what investors need to know about modern battery technology, including raw material supply, demand, and future applications.
Presented by: Nevada Energy Metals, eCobalt Solutions Inc., and Great Lakes Graphite


The Critical Ingredients Needed to Fuel the Battery Boom
We’ve already looked at the evolution of battery technology and how lithium-ion technology will dominate battery market share over the coming years. Part 4 of the Battery Series breaks down the raw materials that will be needed for this battery boom.
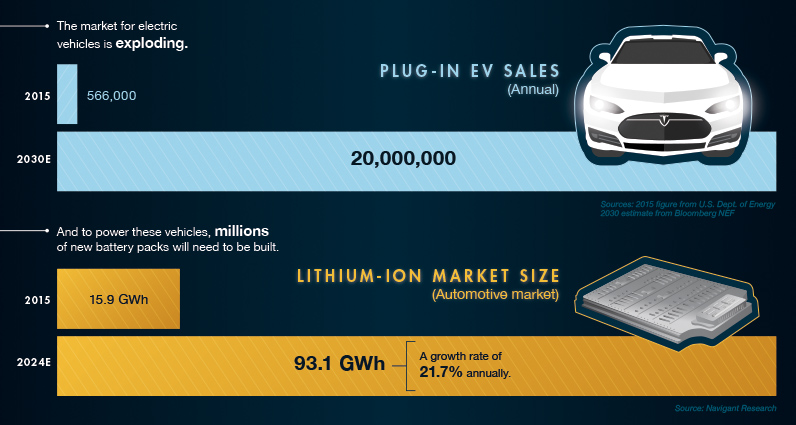
Batteries are more powerful and reliable than ever, and costs have come down dramatically over years. As a result, the market for electric vehicles is expected to explode to 20 million plug-in EV sales per year by 2030.


To power these vehicles, millions of new battery packs will need to be built. The lithium-ion battery market is expected to grow at a 21.7% rate annually in terms of the actual energy capacity required. It was 15.9 GWh in 2015, but will be a whopping 93.1 GWh by 2024.
Dissecting the Lithium-Ion
While there are many exciting battery technologies out there, we will focus on the innards of lithium-ion batteries as they are expected to make up the vast majority of the total rechargeable battery market for the near future.
Each lithium-ion cell contains three major parts:
1) Anode (natural or synthetic graphite)
2) Electrolyte (lithium salts
3) Cathode (differing formulations)
While the anode and electrolytes are pretty straightforward as far as lithium-ion technology goes, it is the cathode where most developments are being made.
Lithium isn’t the only metal that goes into the cathode – other metals like cobalt, manganese, aluminum, and nickel are also used in different formulations. Here’s four cathode chemistries, the metal proportions (excluding lithium), and an example of what they are used for:
| Cathode Type | Chemistry | Example Metal Portions | Example Use |
|---|---|---|---|
| NCA | LiNiCoAlO2 | 80% Nickel, 15% Cobalt, 5% Aluminum | Tesla Model S |
| LCO | LiCoO2 | 100% Cobalt | Apple iPhone |
| LMO | LiMn2O4 | 100% Manganese | Nissan Leaf |
| NMC | LiNiMnCoO2 | Nickel 33.3%, Manganese 33.3%, Cobalt 33.3% | Tesla Powerwall |
| LFP | LiFePO4 | 100% Iron | Starter batteries |
While manganese and aluminum are important for lithium-ion cathodes, they are also cheaper metals with giant markets. This makes them fairly easy to procure for battery manufacturers.
Lithium, graphite, and cobalt, are all much smaller and less-established markets – and each has supply concerns that remain unanswered:
- South America: The countries in the “Lithium Triangle” host a whopping 75% of the world’s lithium resources: Argentina, Chile, and Bolivia.
- China: 65% of flake graphite is mined in China. With poor environmental and labor practices, China’s graphite industry has been under particular scrutiny – and some mines have even been shut down.
- Indonesia: Price swings of nickel can impact battery makers. In 2014, Indonesia banned exports of nickel, which caused the price to soar nearly 50%.
- DRC: 65% of all cobalt production comes from the DRC, a country that is extremely politically unstable with deeply-rooted corruption.
- North America: Yet, companies such as Tesla have stated that they want to source 100% of raw materials sustainably and ethically from North America. The problem? Only nickel sees significant supply come from the continent.
Cobalt hasn’t been mined in the United States for 40 years, and the country produced zero tonnes of graphite in 2015. There is one lithium operation near the Tesla Gigafactory 1 site but it only produces 1,000 tonnes of lithium hydroxide per year. That’s not nearly enough to fuel a battery boom of this size.
To meet its goal of a 100% North American raw materials supply chain, Tesla needs new resources to be discovered and extracted from the U.S., Canada, or Mexico.
Raw Material Demand
While all sorts of supply questions exist for these energy metals, the demand situation is much more straightforward.
Consumers are demanding more batteries, and each battery is made up of raw materials like cobalt, graphite, and lithium.
Cobalt:
Today, about 40% of cobalt is used to make rechargeable batteries. By 2019, it’s expected that 55% of total cobalt demand will go to the cause.
In fact, many analysts see an upcoming bull market in cobalt.
- Battery demand is rising fast
- Production is being cut from the Congo
- A supply deficit is starting to emerge
“In many ways, the cobalt industry has the most fragile supply structure of all battery raw materials.” – Andrew Miller, Benchmark Mineral Intelligence
Graphite:
There is 54kg of graphite in every battery anode of a Tesla Model S (85kWh).
Benchmark Mineral Intelligence forecasts that the battery anode market for graphite (natural and synthetic) will at least triple in size from 80,000 tonnes in 2015 to at least 250,000 tonnes by the end of 2020.
Lithium:
Goldman Sachs estimates that a Tesla Model S with a 70kWh battery uses 63 kilograms of lithium carbonate equivalent (LCE) – more than the amount of lithium in 10,000 cell phones.
Further, for every 1% increase in battery electric vehicle (BEV) market penetration, there is an increase in lithium demand by around 70,000 tonnes LCE/year.
Lithium prices have recently spiked, but they may begin sliding in 2019 if more supply comes online.
The Future of Battery Tech
Sourcing the raw materials for lithium-ion batteries will be critical for our energy mix.
But, the future is also bright for many other battery technologies that could help in solving our most pressing energy issues.
Part 5 of The Battery Series will look at the newest technologies in the battery sector.


Energy
The World’s Biggest Nuclear Energy Producers
China has grown its nuclear capacity over the last decade, now ranking second on the list of top nuclear energy producers.


The World’s Biggest Nuclear Energy Producers
This was originally posted on our Voronoi app. Download the app for free on Apple or Android and discover incredible data-driven charts from a variety of trusted sources.
Scientists in South Korea recently broke a record in a nuclear fusion experiment. For 48 seconds, they sustained a temperature seven times that of the sun’s core.
But generating commercially viable energy from nuclear fusion still remains more science fiction than reality. Meanwhile, its more reliable sibling, nuclear fission, has been powering our world for many decades.
In this graphic, we visualized the top producers of nuclear energy by their share of the global total, measured in terawatt hours (TWh). Data for this was sourced from the Nuclear Energy Institute, last updated in August 2022.
Which Country Generates the Most Nuclear Energy?
Nuclear energy production in the U.S. is more than twice the amount produced by China (ranked second) and France (ranked third) put together. In total, the U.S. accounts for nearly 30% of global nuclear energy output.
However, nuclear power only accounts for one-fifth of America’s electricity supply. This is in contrast to France, which generates 60% of its electricity from nuclear plants.
| Rank | Country | Nuclear Energy Produced (TWh) | % of Total |
|---|---|---|---|
| 1 | 🇺🇸 U.S. | 772 | 29% |
| 2 | 🇨🇳 China | 383 | 14% |
| 3 | 🇫🇷 France | 363 | 14% |
| 4 | 🇷🇺 Russia | 208 | 8% |
| 5 | 🇰🇷 South Korea | 150 | 6% |
| 6 | 🇨🇦 Canada | 87 | 3% |
| 7 | 🇺🇦 Ukraine | 81 | 3% |
| 8 | 🇩🇪 Germany | 65 | 2% |
| 9 | 🇯🇵 Japan | 61 | 2% |
| 10 | 🇪🇸 Spain | 54 | 2% |
| 11 | 🇸🇪 Sweden | 51 | 2% |
| 12 | 🇧🇪 Belgium | 48 | 2% |
| 13 | 🇬🇧 UK | 42 | 2% |
| 14 | 🇮🇳 India | 40 | 2% |
| 15 | 🇨🇿 Czech Republic | 29 | 1% |
| N/A | 🌐 Other | 219 | 8% |
| N/A | 🌍 Total | 2,653 | 100% |
Another highlight is how China has rapidly grown its nuclear energy capabilities in the last decade. Between 2016 and 2021, for example, it increased its share of global nuclear energy output from less than 10% to more than 14%, overtaking France for second place.
On the opposite end, the UK’s share has slipped to 2% over the same time period.
Meanwhile, Ukraine has heavily relied on nuclear energy to power its grid. In March 2022, it lost access to its key Zaporizhzhia Nuclear Power Station after Russian forces wrested control of the facility. With six 1,000 MW reactors, the plant is one of the largest in Europe. It is currently not producing any power, and has been the site of recent drone attacks.

-

 Real Estate2 weeks ago
Visualizing America’s Shortage of Affordable Homes
-

 Technology1 week ago
Ranked: Semiconductor Companies by Industry Revenue Share
-

 Money1 week ago
Which States Have the Highest Minimum Wage in America?
-

 Real Estate1 week ago
Ranked: The Most Valuable Housing Markets in America
-

 Business1 week ago
Charted: Big Four Market Share by S&P 500 Audits
-

 AI2 weeks ago
The Stock Performance of U.S. Chipmakers So Far in 2024
-

 Misc2 weeks ago
Almost Every EV Stock is Down After Q1 2024
-

 Money2 weeks ago
Where Does One U.S. Tax Dollar Go?