Markets
Which Countries Have the Most Economic Complexity?
Every country has an economy that is unique.
In some places, such as the United States or Germany, economies are able to produce many different goods and services that get exported around the world. These countries tend to house world-class businesses in sectors like financials, technology, consumer goods, and healthcare, with companies that produce highly specialized goods like automobiles, software, or pharmaceutical products. Ultimately, these are innovative economies that can roll with the punches, creating growth even when prospects are dim.
In other places, this level of sophistication is just not there. Innovation and knowledge are stunted or non-existent for most industries, and these countries may focus exclusively on one or two goods to pay the bills. Venezuela’s reliance on oil is an obvious example of this, but there are even many Western countries that miss the mark here as well.
Measuring Economic Complexity
In 2009, a team at Harvard formalized a measure of economic complexity that compared nations based on the sophistication of their economies. Now known as the Economic Complexity Index (ECI), the exact measurement is complicated, but it essentially uses data on two main things to uncover the underlying level of economic complexity:
1. Economic Diversity
Measures how many different products a country can produce.
2. Economic Ubiquity
Measures how many countries are able to make those products.
In other words: if a country produces only a few goods, that economy is not very complex. Further, if a country produces many different products, but they are all simple ones that can be replicated elsewhere, the economy is still not complex. See full details on the project here.
Ranking the Most Complex Economies
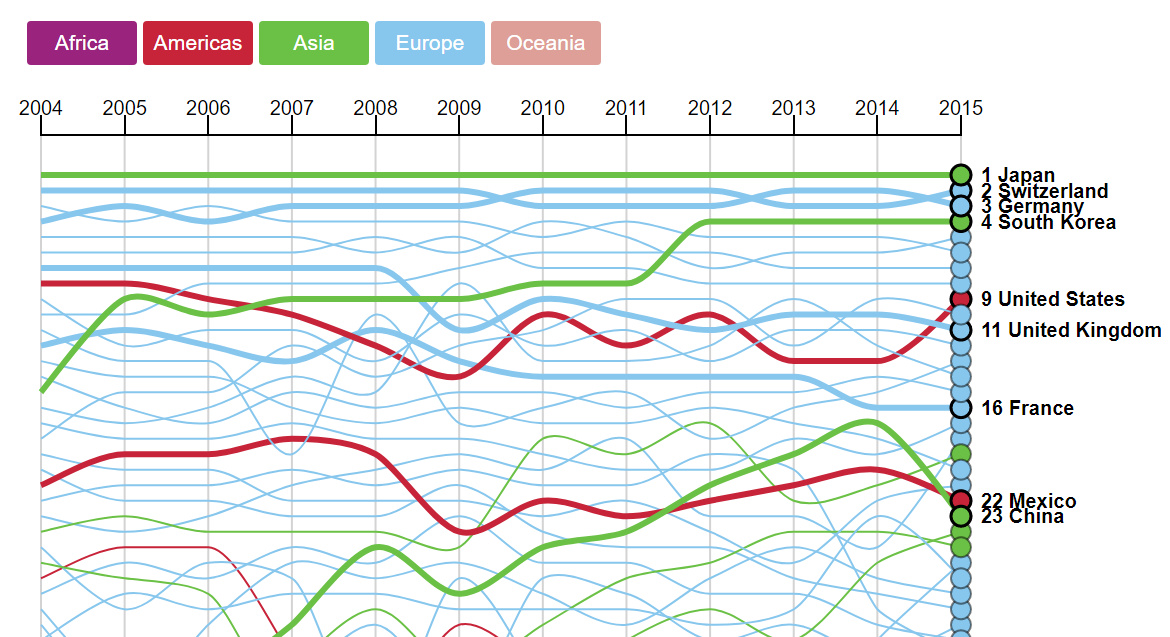
Here are the most complex economies in order, along with the changing rankings over time:
As you’ll notice, the most recent set of data is from 2015.
Topping the list are the economies of Japan (1st), Switzerland (2nd), Germany (3rd), and South Korea (4th). The United States sits in 9th place, and Canada is further down at 33rd.
Australia, which relies heavily on commodities, ranks notably low for Western countries in 73rd place, where it is sandwiched between Kazakhstan and the Dominican Republic.
Movers and Shakers
The most recent iteration of the index also highlighted some movers and shakers over the last 10 year period:
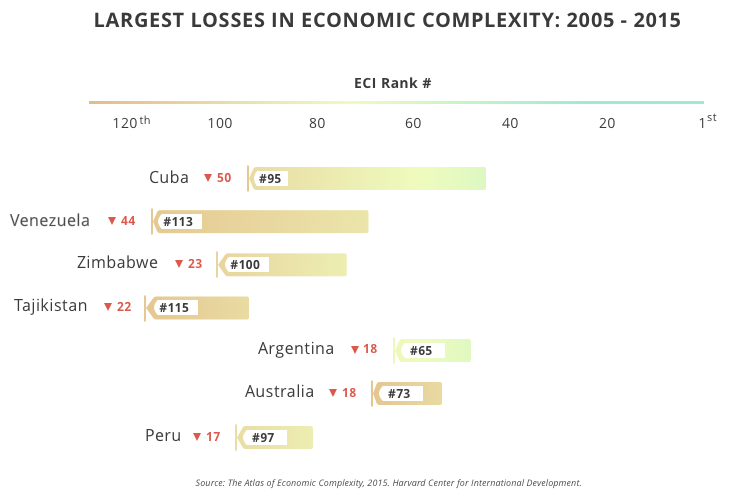
In particular, the crisis in Venezuela has had an effect on economic complexity, eroding any sophistication that existed.
Meanwhile, Cuba’s economy is also in the decline in terms of sophistication – and with major exports including raw sugar (27%), rolled tobacco (15%), nickel (12%), oil (11%), hard liquor (7%), and crustaceans (4%), it’s not hard to see why.
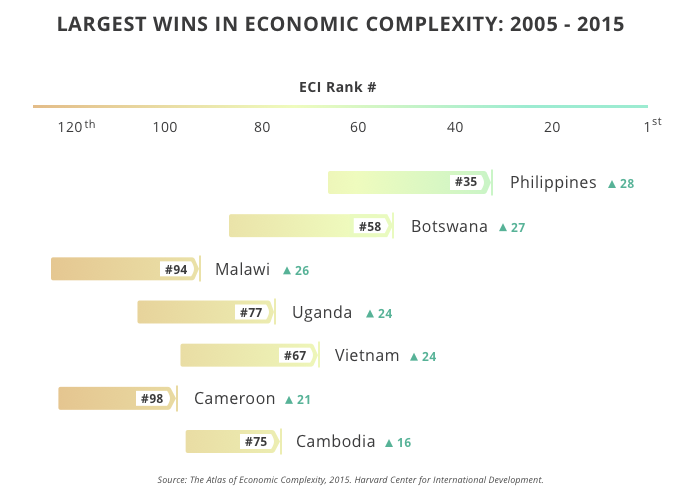
On the opposite side of the spectrum, the Philippines is the biggest mover upwards, ascending 28 spots.
Some African countries are also moving fast up the rankings: Botswana, Malawi, Uganda, and Cameroon each jumped over 20 spots.


Markets
U.S. Debt Interest Payments Reach $1 Trillion
U.S. debt interest payments have surged past the $1 trillion dollar mark, amid high interest rates and an ever-expanding debt burden.


U.S. Debt Interest Payments Reach $1 Trillion
This was originally posted on our Voronoi app. Download the app for free on iOS or Android and discover incredible data-driven charts from a variety of trusted sources.
The cost of paying for America’s national debt crossed the $1 trillion dollar mark in 2023, driven by high interest rates and a record $34 trillion mountain of debt.
Over the last decade, U.S. debt interest payments have more than doubled amid vast government spending during the pandemic crisis. As debt payments continue to soar, the Congressional Budget Office (CBO) reported that debt servicing costs surpassed defense spending for the first time ever this year.
This graphic shows the sharp rise in U.S. debt payments, based on data from the Federal Reserve.
A $1 Trillion Interest Bill, and Growing
Below, we show how U.S. debt interest payments have risen at a faster pace than at another time in modern history:
| Date | Interest Payments | U.S. National Debt |
|---|---|---|
| 2023 | $1.0T | $34.0T |
| 2022 | $830B | $31.4T |
| 2021 | $612B | $29.6T |
| 2020 | $518B | $27.7T |
| 2019 | $564B | $23.2T |
| 2018 | $571B | $22.0T |
| 2017 | $493B | $20.5T |
| 2016 | $460B | $20.0T |
| 2015 | $435B | $18.9T |
| 2014 | $442B | $18.1T |
| 2013 | $425B | $17.2T |
| 2012 | $417B | $16.4T |
| 2011 | $433B | $15.2T |
| 2010 | $400B | $14.0T |
| 2009 | $354B | $12.3T |
| 2008 | $380B | $10.7T |
| 2007 | $414B | $9.2T |
| 2006 | $387B | $8.7T |
| 2005 | $355B | $8.2T |
| 2004 | $318B | $7.6T |
| 2003 | $294B | $7.0T |
| 2002 | $298B | $6.4T |
| 2001 | $318B | $5.9T |
| 2000 | $353B | $5.7T |
| 1999 | $353B | $5.8T |
| 1998 | $360B | $5.6T |
| 1997 | $368B | $5.5T |
| 1996 | $362B | $5.3T |
| 1995 | $357B | $5.0T |
| 1994 | $334B | $4.8T |
| 1993 | $311B | $4.5T |
| 1992 | $306B | $4.2T |
| 1991 | $308B | $3.8T |
| 1990 | $298B | $3.4T |
| 1989 | $275B | $3.0T |
| 1988 | $254B | $2.7T |
| 1987 | $240B | $2.4T |
| 1986 | $225B | $2.2T |
| 1985 | $219B | $1.9T |
| 1984 | $205B | $1.7T |
| 1983 | $176B | $1.4T |
| 1982 | $157B | $1.2T |
| 1981 | $142B | $1.0T |
| 1980 | $113B | $930.2B |
| 1979 | $96B | $845.1B |
| 1978 | $84B | $789.2B |
| 1977 | $69B | $718.9B |
| 1976 | $61B | $653.5B |
| 1975 | $55B | $576.6B |
| 1974 | $50B | $492.7B |
| 1973 | $45B | $469.1B |
| 1972 | $39B | $448.5B |
| 1971 | $36B | $424.1B |
| 1970 | $35B | $389.2B |
| 1969 | $30B | $368.2B |
| 1968 | $25B | $358.0B |
| 1967 | $23B | $344.7B |
| 1966 | $21B | $329.3B |
Interest payments represent seasonally adjusted annual rate at the end of Q4.
At current rates, the U.S. national debt is growing by a remarkable $1 trillion about every 100 days, equal to roughly $3.6 trillion per year.
As the national debt has ballooned, debt payments even exceeded Medicaid outlays in 2023—one of the government’s largest expenditures. On average, the U.S. spent more than $2 billion per day on interest costs last year. Going further, the U.S. government is projected to spend a historic $12.4 trillion on interest payments over the next decade, averaging about $37,100 per American.
Exacerbating matters is that the U.S. is running a steep deficit, which stood at $1.1 trillion for the first six months of fiscal 2024. This has accelerated due to the 43% increase in debt servicing costs along with a $31 billion dollar increase in defense spending from a year earlier. Additionally, a $30 billion increase in funding for the Federal Deposit Insurance Corporation in light of the regional banking crisis last year was a major contributor to the deficit increase.
Overall, the CBO forecasts that roughly 75% of the federal deficit’s increase will be due to interest costs by 2034.

-

 Travel1 week ago
Airline Incidents: How Do Boeing and Airbus Compare?
-

 Markets2 weeks ago
Visualizing America’s Shortage of Affordable Homes
-

 Green2 weeks ago
Ranked: Top Countries by Total Forest Loss Since 2001
-

 Money2 weeks ago
Where Does One U.S. Tax Dollar Go?
-

 Misc2 weeks ago
Almost Every EV Stock is Down After Q1 2024
-

 AI2 weeks ago
The Stock Performance of U.S. Chipmakers So Far in 2024
-

 Markets2 weeks ago
Charted: Big Four Market Share by S&P 500 Audits
-

 Real Estate2 weeks ago
Ranked: The Most Valuable Housing Markets in America