Technology
The Breathtaking Complexity of the Wireless Spectrum
Explore a high resolution version of this graphic
The Breathtaking Complexity of the Wireless Spectrum
Explore the high resolution version of today’s graphic by clicking here.
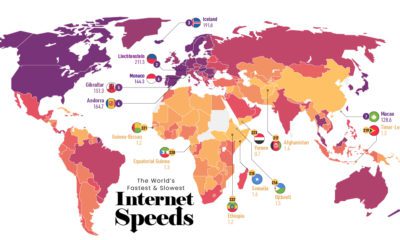
As it turns out, the hottest real estate market may be one we can’t see.
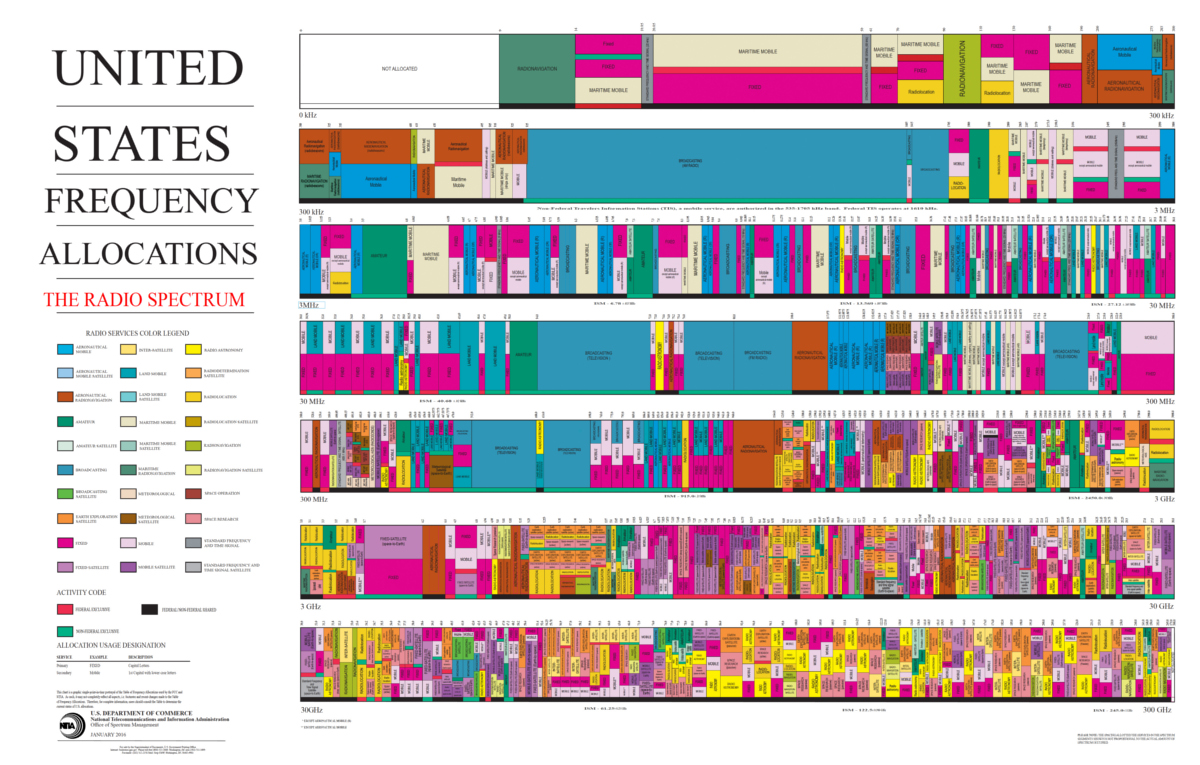
Everything from space exploration signals to HAM radios are vying for room on the radio spectrum, in which frequencies range from 3Hz to 3,000GHz. This spectrum acts as the “transportation system” for all wireless communication, and blocks of it are divvied up for specific uses.
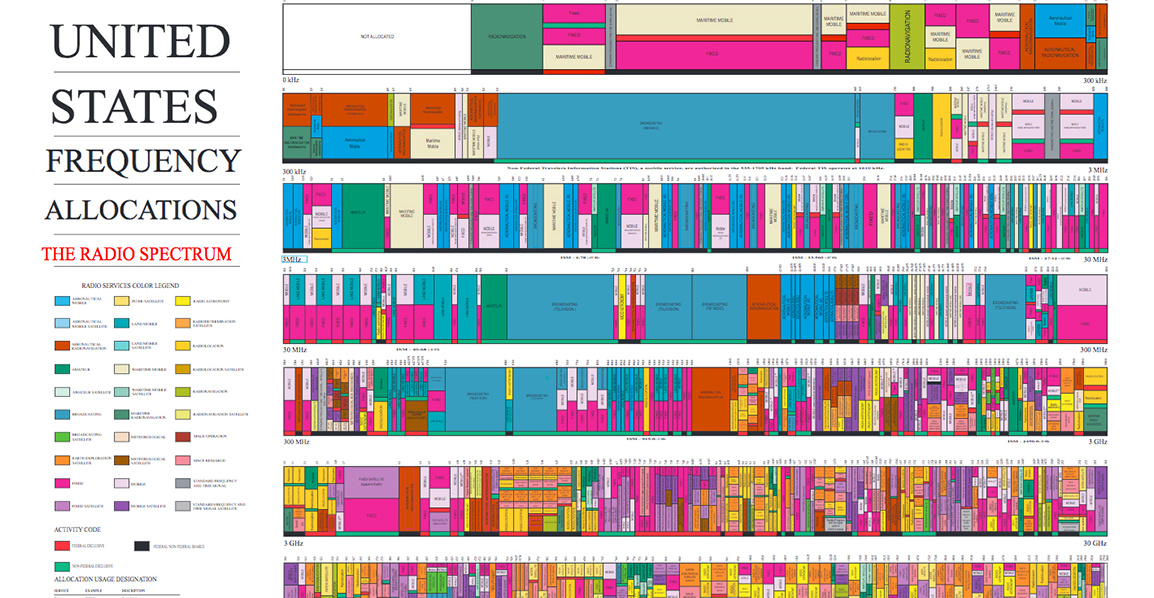
The map above, from the U.S. Department of Commerce, vividly illustrates the complexity of this allocation system.
Plots of “Land” on the Frequency Band
Nearly all of the radio spectrum is already divided into a number of civilian and military uses. Some of the most prominent blocks (turquoise on the map) are set aside for television and radio broadcasting, as well as various types of navigation and satellite communications.
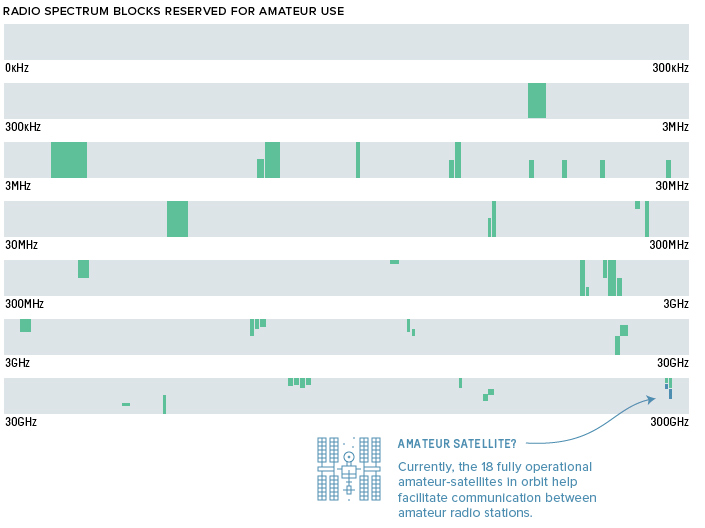
The spectrum also has a number of blocks dedicated to amateur radio and satellite.
It’s worth noting that the allocation map only lays out uses within a specific frequency, and that any number of licenses can exist within a frequency block. For categories like “fixed”, multiple licenses can exist in the same part of band provided they’re far enough apart to avoid signal interference.
Most countries claim ownership over their airwaves, so they each have their own versions of the frequency allocation map. Here are a few others: UK, Canada, and South Africa.
The Spectrum Crunch
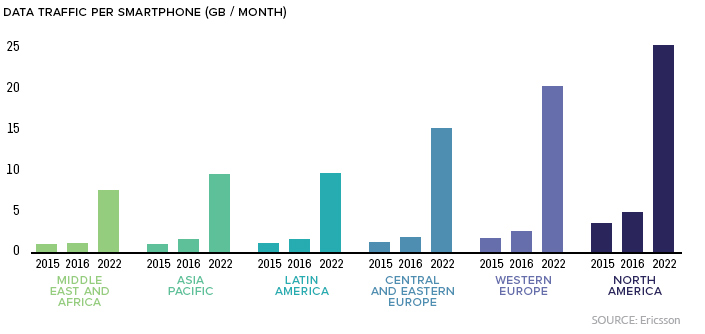
It’s predicted that mobile data traffic will skyrocket in coming years as consumers’ appetite for high quality video streaming continues to grow. Rapid increase in mobile data usage isn’t confined to specific markets. It’s a truly global phenomenon.
Rising data consumption, coupled with the explosion in IoT devices and the emergence of the 5G standard, means that space within the radio band is increasingly coming at a premium.
In fact, periodic auctions for space on the spectrum see telecommunication companies shelling out billions of dollars for a piece of the pie. The spectrum auction run by the FCC in 2015 raised nearly $45 billion and 2017’s auction raised nearly $20 billion.
The hills are alive with data
The long awaited move to 5G is a hot topic in the telecommunications world, and for good reason. 5G is the next generation of wireless technology, which will deliver super-fast connections for smartphones and higher capacity for broadband networks. It’s estimated that 5G will be 100x faster than current 4G networks.
For a fascinating and detailed look at the 5G rollout, check out the video below.


Technology
Ranked: Semiconductor Companies by Industry Revenue Share
Nvidia is coming for Intel’s crown. Samsung is losing ground. AI is transforming the space. We break down revenue for semiconductor companies.


Semiconductor Companies by Industry Revenue Share
This was originally posted on our Voronoi app. Download the app for free on Apple or Android and discover incredible data-driven charts from a variety of trusted sources.
Did you know that some computer chips are now retailing for the price of a new BMW?
As computers invade nearly every sphere of life, so too have the chips that power them, raising the revenues of the businesses dedicated to designing them.
But how did various chipmakers measure against each other last year?
We rank the biggest semiconductor companies by their percentage share of the industry’s revenues in 2023, using data from Omdia research.
Which Chip Company Made the Most Money in 2023?
Market leader and industry-defining veteran Intel still holds the crown for the most revenue in the sector, crossing $50 billion in 2023, or 10% of the broader industry’s topline.
All is not well at Intel, however, with the company’s stock price down over 20% year-to-date after it revealed billion-dollar losses in its foundry business.
| Rank | Company | 2023 Revenue | % of Industry Revenue |
|---|---|---|---|
| 1 | Intel | $51B | 9.4% |
| 2 | NVIDIA | $49B | 9.0% |
| 3 | Samsung Electronics | $44B | 8.1% |
| 4 | Qualcomm | $31B | 5.7% |
| 5 | Broadcom | $28B | 5.2% |
| 6 | SK Hynix | $24B | 4.4% |
| 7 | AMD | $22B | 4.1% |
| 8 | Apple | $19B | 3.4% |
| 9 | Infineon Tech | $17B | 3.2% |
| 10 | STMicroelectronics | $17B | 3.2% |
| 11 | Texas Instruments | $17B | 3.1% |
| 12 | Micron Technology | $16B | 2.9% |
| 13 | MediaTek | $14B | 2.6% |
| 14 | NXP | $13B | 2.4% |
| 15 | Analog Devices | $12B | 2.2% |
| 16 | Renesas Electronics Corporation | $11B | 1.9% |
| 17 | Sony Semiconductor Solutions Corporation | $10B | 1.9% |
| 18 | Microchip Technology | $8B | 1.5% |
| 19 | Onsemi | $8B | 1.4% |
| 20 | KIOXIA Corporation | $7B | 1.3% |
| N/A | Others | $126B | 23.2% |
| N/A | Total | $545B | 100% |
Note: Figures are rounded. Totals and percentages may not sum to 100.
Meanwhile, Nvidia is very close to overtaking Intel, after declaring $49 billion of topline revenue for 2023. This is more than double its 2022 revenue ($21 billion), increasing its share of industry revenues to 9%.
Nvidia’s meteoric rise has gotten a huge thumbs-up from investors. It became a trillion dollar stock last year, and broke the single-day gain record for market capitalization this year.
Other chipmakers haven’t been as successful. Out of the top 20 semiconductor companies by revenue, 12 did not match their 2022 revenues, including big names like Intel, Samsung, and AMD.
The Many Different Types of Chipmakers
All of these companies may belong to the same industry, but they don’t focus on the same niche.
According to Investopedia, there are four major types of chips, depending on their functionality: microprocessors, memory chips, standard chips, and complex systems on a chip.
Nvidia’s core business was once GPUs for computers (graphics processing units), but in recent years this has drastically shifted towards microprocessors for analytics and AI.
These specialized chips seem to be where the majority of growth is occurring within the sector. For example, companies that are largely in the memory segment—Samsung, SK Hynix, and Micron Technology—saw peak revenues in the mid-2010s.

-

 Green2 weeks ago
Ranked: Top Countries by Total Forest Loss Since 2001
-

 Travel1 week ago
Ranked: The World’s Top Flight Routes, by Revenue
-

 Technology1 week ago
Ranked: Semiconductor Companies by Industry Revenue Share
-

 Money2 weeks ago
Which States Have the Highest Minimum Wage in America?
-

 Real Estate2 weeks ago
Ranked: The Most Valuable Housing Markets in America
-

 Markets2 weeks ago
Charted: Big Four Market Share by S&P 500 Audits
-

 AI2 weeks ago
The Stock Performance of U.S. Chipmakers So Far in 2024
-

 Automotive2 weeks ago
Almost Every EV Stock is Down After Q1 2024