Markets
The 10 Companies That Dominate the Global Arms Trade
The 10 Companies That Dominate the Global Arms Trade
The Chart of the Week is a weekly Visual Capitalist feature on Fridays.
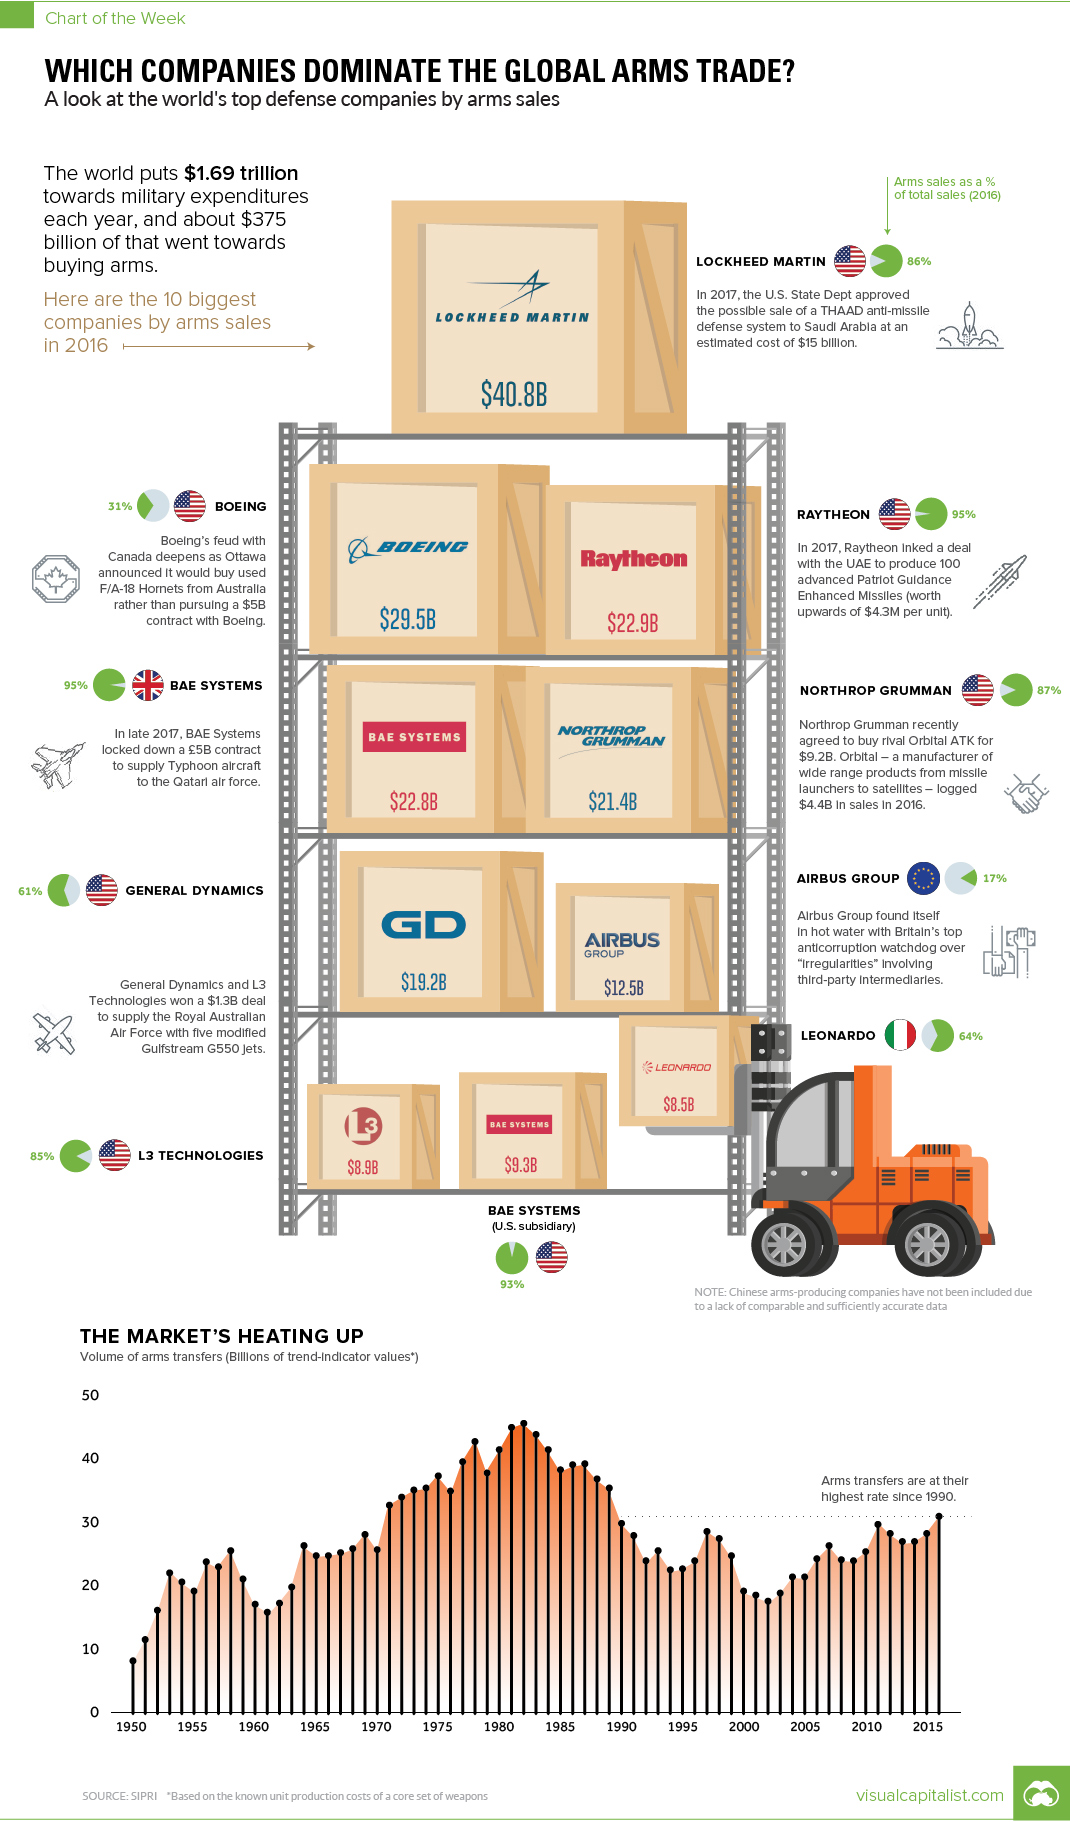
The world puts $1.69 trillion towards military expenditures per year, and about $375 billion of that goes towards buying arms specifically.
Whether it is guns, tanks, jets, missiles, or ships that are on your shopping list, in the international arms community, there is a supplier for any weapon your country desires.
Arms dealers, by sales
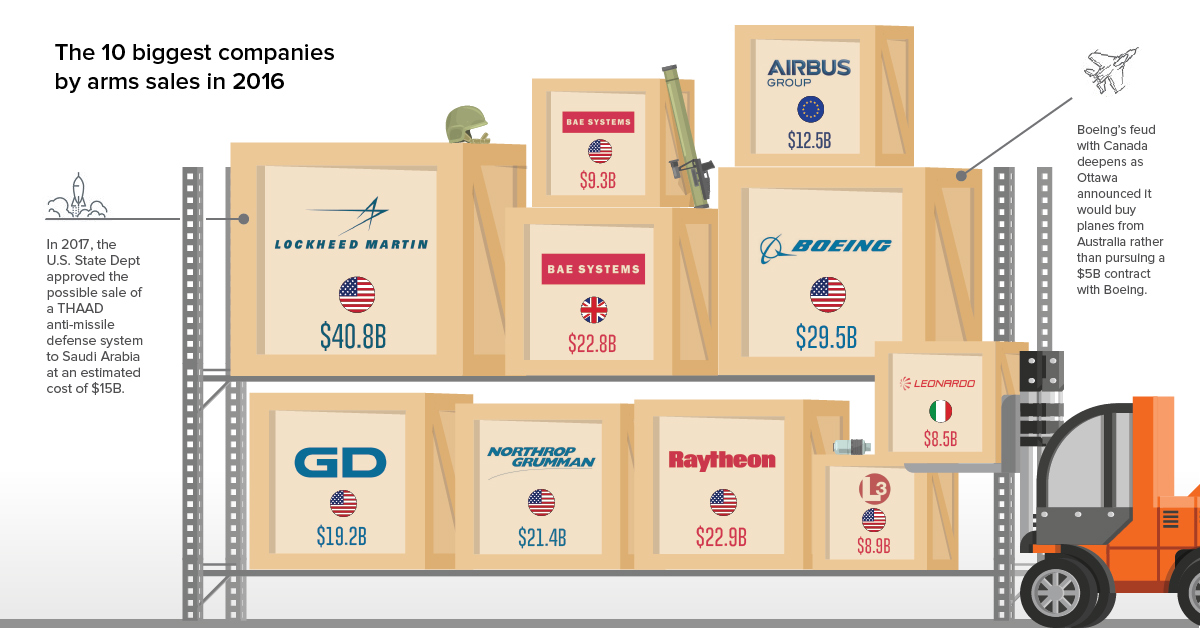
Today’s chart organizes the world’s top arms companies by sales, location, and arms as a percentage of sales:
| Rank | Company | Country | Arms sales (2016) | Arms as % of sales |
|---|---|---|---|---|
| #1 | Lockheed Martin | USA | $40.8B | 86% |
| #2 | Boeing | USA | $29.5B | 31% |
| #3 | Raytheon | USA | $22.9B | 95% |
| #4 | BAE Systems | UK | $22.8B | 95% |
| #5 | Northrop Grumman | USA | $21.4B | 87% |
| #6 | General Dynamics | USA | $19.2B | 61% |
| #7 | Airbus Group | EU | $12.5B | 17% |
| #8 | BAE Systems (U.S.) | USA | $9.3B | 93% |
| #9 | L3 Technologies | USA | $8.9B | 85% |
| #10 | Leonardo | Italy | $8.5B | 64% |
Note: Airbus considers itself a European company. It’s registered in the Netherlands, and its main HQ is in France.
The above data comes courtesy of the Stockholm International Peace Research Institute (SIPRI), which tracks arms deals and companies extensively.
USA, USA!
While it is common knowledge that the United States plays a big role in the global arms trade, the numbers are still quite astounding.
Of the top ten companies by sales, firms based in the U.S. make up seven of them. That includes the clear #1, Lockheed Martin, which had $40.8 billion in arms-related sales in 2016, as well as the remaining constituents of the top three: Boeing and Raytheon.
Further, on SIPRI’s wider top 100 list, a good proxy for total arms sales globally, U.S. defense companies accounted for a whopping 58% of total global arms sales. That adds up to $217.2 billion in 2016, a 4.0% rise over the previous year.
Rounding Out the Top 10
Only three companies make the top 10 leaderboard from outside of the United States.
That group includes Airbus, the massive European commercial airline manufacturer that gets 17% of its sales from arms-related deals, as well as BAE Systems (U.K.) and Leonardo (Italy).
As a final caveat, it’s worth mentioning that SIPRI notes that some Chinese companies would likely make its Top 100 list as well – but for now, the list excludes Chinese companies as the available data is not comparable or accurate.


Economy
Economic Growth Forecasts for G7 and BRICS Countries in 2024
The IMF has released its economic growth forecasts for 2024. How do the G7 and BRICS countries compare?


G7 & BRICS Real GDP Growth Forecasts for 2024
The International Monetary Fund’s (IMF) has released its real gross domestic product (GDP) growth forecasts for 2024, and while global growth is projected to stay steady at 3.2%, various major nations are seeing declining forecasts.
This chart visualizes the 2024 real GDP growth forecasts using data from the IMF’s 2024 World Economic Outlook for G7 and BRICS member nations along with Saudi Arabia, which is still considering an invitation to join the bloc.
Get the Key Insights of the IMF’s World Economic Outlook
Want a visual breakdown of the insights from the IMF’s 2024 World Economic Outlook report?
This visual is part of a special dispatch of the key takeaways exclusively for VC+ members.
Get the full dispatch of charts by signing up to VC+.
Mixed Economic Growth Prospects for Major Nations in 2024
Economic growth projections by the IMF for major nations are mixed, with the majority of G7 and BRICS countries forecasted to have slower growth in 2024 compared to 2023.
Only three BRICS-invited or member countries, Saudi Arabia, the UAE, and South Africa, have higher projected real GDP growth rates in 2024 than last year.
| Group | Country | Real GDP Growth (2023) | Real GDP Growth (2024P) |
|---|---|---|---|
| G7 | 🇺🇸 U.S. | 2.5% | 2.7% |
| G7 | 🇨🇦 Canada | 1.1% | 1.2% |
| G7 | 🇯🇵 Japan | 1.9% | 0.9% |
| G7 | 🇫🇷 France | 0.9% | 0.7% |
| G7 | 🇮🇹 Italy | 0.9% | 0.7% |
| G7 | 🇬🇧 UK | 0.1% | 0.5% |
| G7 | 🇩🇪 Germany | -0.3% | 0.2% |
| BRICS | 🇮🇳 India | 7.8% | 6.8% |
| BRICS | 🇨🇳 China | 5.2% | 4.6% |
| BRICS | 🇦🇪 UAE | 3.4% | 3.5% |
| BRICS | 🇮🇷 Iran | 4.7% | 3.3% |
| BRICS | 🇷🇺 Russia | 3.6% | 3.2% |
| BRICS | 🇪🇬 Egypt | 3.8% | 3.0% |
| BRICS-invited | 🇸🇦 Saudi Arabia | -0.8% | 2.6% |
| BRICS | 🇧🇷 Brazil | 2.9% | 2.2% |
| BRICS | 🇿🇦 South Africa | 0.6% | 0.9% |
| BRICS | 🇪🇹 Ethiopia | 7.2% | 6.2% |
| 🌍 World | 3.2% | 3.2% |
China and India are forecasted to maintain relatively high growth rates in 2024 at 4.6% and 6.8% respectively, but compared to the previous year, China is growing 0.6 percentage points slower while India is an entire percentage point slower.
On the other hand, four G7 nations are set to grow faster than last year, which includes Germany making its comeback from its negative real GDP growth of -0.3% in 2023.
Faster Growth for BRICS than G7 Nations
Despite mostly lower growth forecasts in 2024 compared to 2023, BRICS nations still have a significantly higher average growth forecast at 3.6% compared to the G7 average of 1%.
While the G7 countries’ combined GDP is around $15 trillion greater than the BRICS nations, with continued higher growth rates and the potential to add more members, BRICS looks likely to overtake the G7 in economic size within two decades.
BRICS Expansion Stutters Before October 2024 Summit
BRICS’ recent expansion has stuttered slightly, as Argentina’s newly-elected president Javier Milei declined its invitation and Saudi Arabia clarified that the country is still considering its invitation and has not joined BRICS yet.
Even with these initial growing pains, South Africa’s Foreign Minister Naledi Pandor told reporters in February that 34 different countries have submitted applications to join the growing BRICS bloc.
Any changes to the group are likely to be announced leading up to or at the 2024 BRICS summit which takes place October 22-24 in Kazan, Russia.
Get the Full Analysis of the IMF’s Outlook on VC+
This visual is part of an exclusive special dispatch for VC+ members which breaks down the key takeaways from the IMF’s 2024 World Economic Outlook.
For the full set of charts and analysis, sign up for VC+.

-

 Markets1 week ago
U.S. Debt Interest Payments Reach $1 Trillion
-

 Business2 weeks ago
Charted: Big Four Market Share by S&P 500 Audits
-

 Markets2 weeks ago
Ranked: The Most Valuable Housing Markets in America
-

 Money2 weeks ago
Which States Have the Highest Minimum Wage in America?
-

 AI2 weeks ago
Ranked: Semiconductor Companies by Industry Revenue Share
-

 Markets2 weeks ago
Ranked: The World’s Top Flight Routes, by Revenue
-

 Demographics2 weeks ago
Population Projections: The World’s 6 Largest Countries in 2075
-

 Markets2 weeks ago
The Top 10 States by Real GDP Growth in 2023