Energy
Commodities: Silver Skyrockets Post-Brexit, Energy is Back!
Commodities: Silver Skyrockets Post-Brexit, Energy is Back!
Commodities are back!
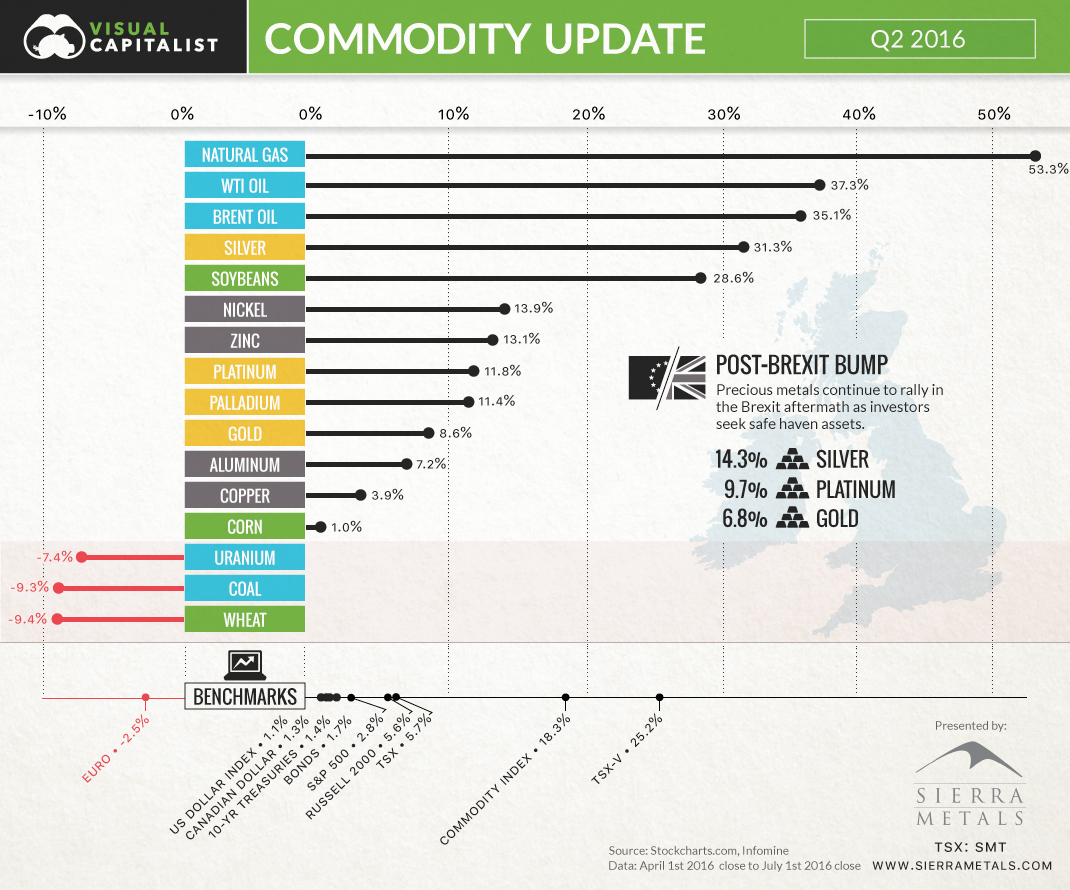
While commodity performance in Q1 was promising, it was mainly precious metals and zinc that buoyed everything else. Energy and base metals were relatively flat on the quarter, with uranium and natural gas having the biggest declines.
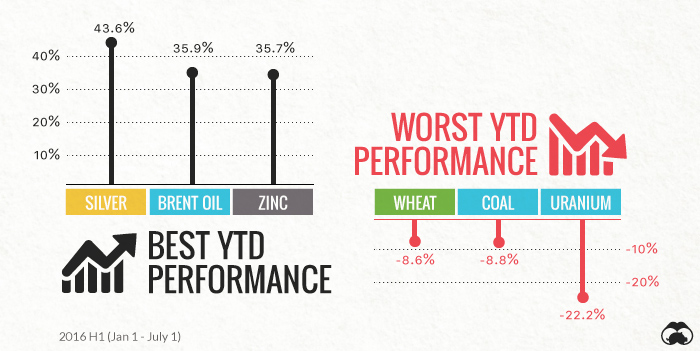
However, the game changed considerably in Q2. We now live in a post-Brexit world, where the real risk of further contagion in Europe is prompting investors to seek insurance policies. Silver is hovering near the $20 mark, which makes it the best performing commodity of the first half of 2016 with a 43.6% return.
But it’s not just precious metals that are back in vogue.
Energy had an impressive comeback in Q2, with natural gas and oil being the best performing commodities of the quarter. Base metals were up, and even the TSX Venture, a Canadian index tracking many of the world’s junior mining and energy stocks, was the best performing benchmark. This is meaningful, because it wasn’t long ago that the TSX Venture was in a mind-boggling 1,000+ day bear market.
Q2 Commodities by Subsector
Precious Metals
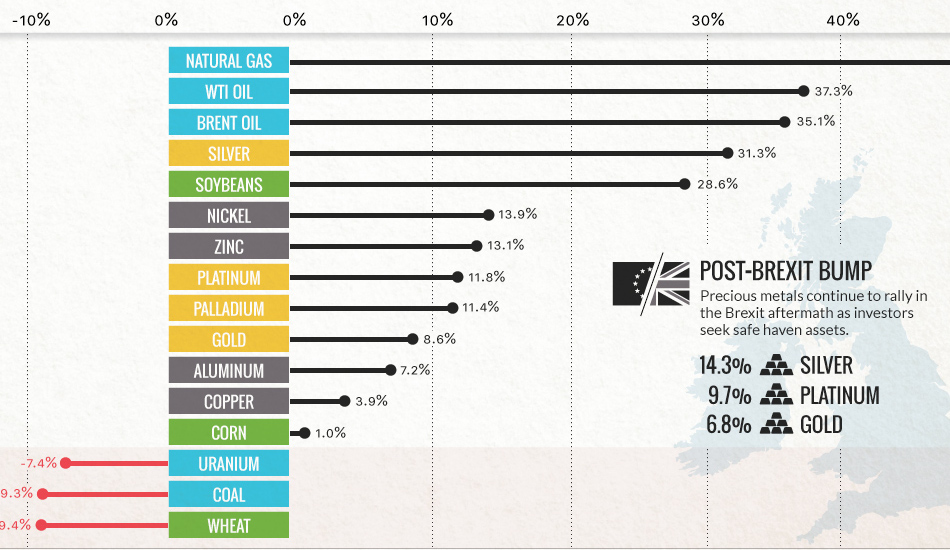
Gold, silver, and platinum all received a significant boost post-Brexit. In the week following the June 23 referendum, they were up 6.8%, 14.3%, and 9.7% respectively. Billionaire voices envisioning a potential bull market for precious metals include Stanley Druckenmiller, George Soros, and Ray Dalio.
Base Metals
Base metals, which did not receive a lot of fanfare in 2015, may have finally stopped the bleeding. Copper was virtually flat in Q1, while gaining 3.9% in Q2. Meanwhile, nickel and zinc both had double-digit quarters with 13.9% and 13.1% returns respectively. Zinc is up an impressive 35.7% YTD.
Energy
The energy sector came back with a vengeance. Brent and WTI had their best quarters in years with 35.1% and 37.3% increases. Natural gas was the top performing commodity in Q2, jumping up 53.3% to just short of $3/MMbtu because of unanticipated summer demand. On the other side of the energy spectrum, coal had another poor quarter, dropping -9.3% in price. (In a recent set of charts, we covered the decline in coal in depth.)
Food
The world’s agricultural commodities had a mixed bag for performance. Wheat was the worst performer, down -9.4% on the quarter. Corn was relatively flat, and soybeans jumped up 28.6%.
Chart presented by: Sierra Metals


Energy
The World’s Biggest Nuclear Energy Producers
China has grown its nuclear capacity over the last decade, now ranking second on the list of top nuclear energy producers.


The World’s Biggest Nuclear Energy Producers
This was originally posted on our Voronoi app. Download the app for free on Apple or Android and discover incredible data-driven charts from a variety of trusted sources.
Scientists in South Korea recently broke a record in a nuclear fusion experiment. For 48 seconds, they sustained a temperature seven times that of the sun’s core.
But generating commercially viable energy from nuclear fusion still remains more science fiction than reality. Meanwhile, its more reliable sibling, nuclear fission, has been powering our world for many decades.
In this graphic, we visualized the top producers of nuclear energy by their share of the global total, measured in terawatt hours (TWh). Data for this was sourced from the Nuclear Energy Institute, last updated in August 2022.
Which Country Generates the Most Nuclear Energy?
Nuclear energy production in the U.S. is more than twice the amount produced by China (ranked second) and France (ranked third) put together. In total, the U.S. accounts for nearly 30% of global nuclear energy output.
However, nuclear power only accounts for one-fifth of America’s electricity supply. This is in contrast to France, which generates 60% of its electricity from nuclear plants.
| Rank | Country | Nuclear Energy Produced (TWh) | % of Total |
|---|---|---|---|
| 1 | 🇺🇸 U.S. | 772 | 29% |
| 2 | 🇨🇳 China | 383 | 14% |
| 3 | 🇫🇷 France | 363 | 14% |
| 4 | 🇷🇺 Russia | 208 | 8% |
| 5 | 🇰🇷 South Korea | 150 | 6% |
| 6 | 🇨🇦 Canada | 87 | 3% |
| 7 | 🇺🇦 Ukraine | 81 | 3% |
| 8 | 🇩🇪 Germany | 65 | 2% |
| 9 | 🇯🇵 Japan | 61 | 2% |
| 10 | 🇪🇸 Spain | 54 | 2% |
| 11 | 🇸🇪 Sweden | 51 | 2% |
| 12 | 🇧🇪 Belgium | 48 | 2% |
| 13 | 🇬🇧 UK | 42 | 2% |
| 14 | 🇮🇳 India | 40 | 2% |
| 15 | 🇨🇿 Czech Republic | 29 | 1% |
| N/A | 🌐 Other | 219 | 8% |
| N/A | 🌍 Total | 2,653 | 100% |
Another highlight is how China has rapidly grown its nuclear energy capabilities in the last decade. Between 2016 and 2021, for example, it increased its share of global nuclear energy output from less than 10% to more than 14%, overtaking France for second place.
On the opposite end, the UK’s share has slipped to 2% over the same time period.
Meanwhile, Ukraine has heavily relied on nuclear energy to power its grid. In March 2022, it lost access to its key Zaporizhzhia Nuclear Power Station after Russian forces wrested control of the facility. With six 1,000 MW reactors, the plant is one of the largest in Europe. It is currently not producing any power, and has been the site of recent drone attacks.

-

 Green2 weeks ago
Ranked: Top Countries by Total Forest Loss Since 2001
-

 Travel1 week ago
Ranked: The World’s Top Flight Routes, by Revenue
-

 Technology1 week ago
Ranked: Semiconductor Companies by Industry Revenue Share
-

 Money2 weeks ago
Which States Have the Highest Minimum Wage in America?
-

 Real Estate2 weeks ago
Ranked: The Most Valuable Housing Markets in America
-

 Markets2 weeks ago
Charted: Big Four Market Share by S&P 500 Audits
-

 AI2 weeks ago
The Stock Performance of U.S. Chipmakers So Far in 2024
-

 Automotive2 weeks ago
Almost Every EV Stock is Down After Q1 2024