Misc
Color in Branding: What Does it Say About Your Industry?
Color in Branding: What Does it Say About Your Industry?
The use of color can be a powerful way to guide the associations consumers have about a brand, but how and why certain colors are used can often be perplexing.
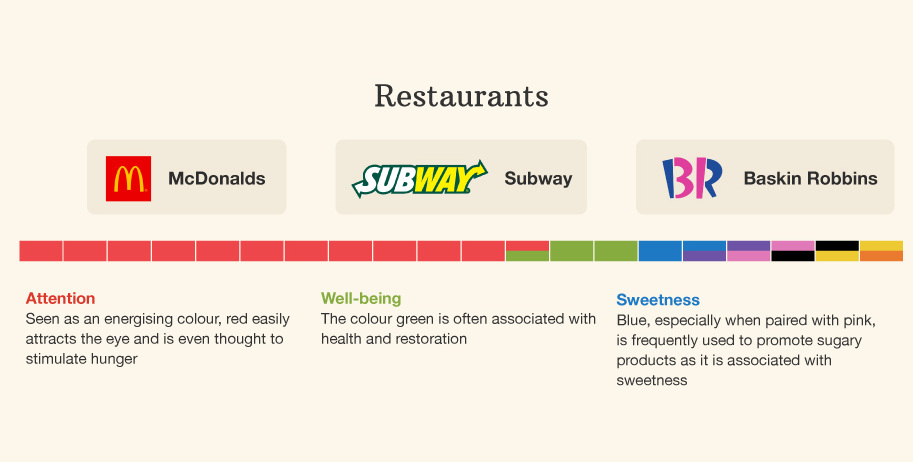
The color red is the perfect example. When it is used as a primary color for McDonald’s, red is meant to energize and attract the attention of potential customers. Red is also thought by some psychologists as a hunger stimulant, which might help them sell more Big Macs and McNuggets at the end of the day.
However, in the case of a company such as British Airways, red is supposed to represent none of those things. For an airline brand, red should be about warmth and a sense of caring, and it ostensibly helps to make customers feel more comfortable flying. For the famous shoe brand Vans, the color red is supposed to evoke feelings of desire and passion, with a hope that customers will link these concepts intrinsically to their brand.
How can red mean so many different things at the same time? The answer is context, much of which is provided by consumers choosing between brands within a particular industry.
Color and Context
When consumers plan to make a purchase decision, they are typically deciding between an evoked set of companies that they’re familiar with for a specific industry or sector. In buying an automobile, for example, a consumer may only to be willing to only consider buying a Toyota, Ford, or Honda.
Since these brands are competing against one another for a “spot” in the mind of consumers, their brands are positioned based on consumer needs and desires in order to win certain associations. Color is an important part of this – but the need is only to differentiate from competitors within an industry, since non-auto brands like McDonald’s or Calvin Klein are not a part of the evoked set of brand choices in this situation.
Therefore, industry context is an essential factor that determines the color choices made by companies for their branding.
Examples: Color in Branding
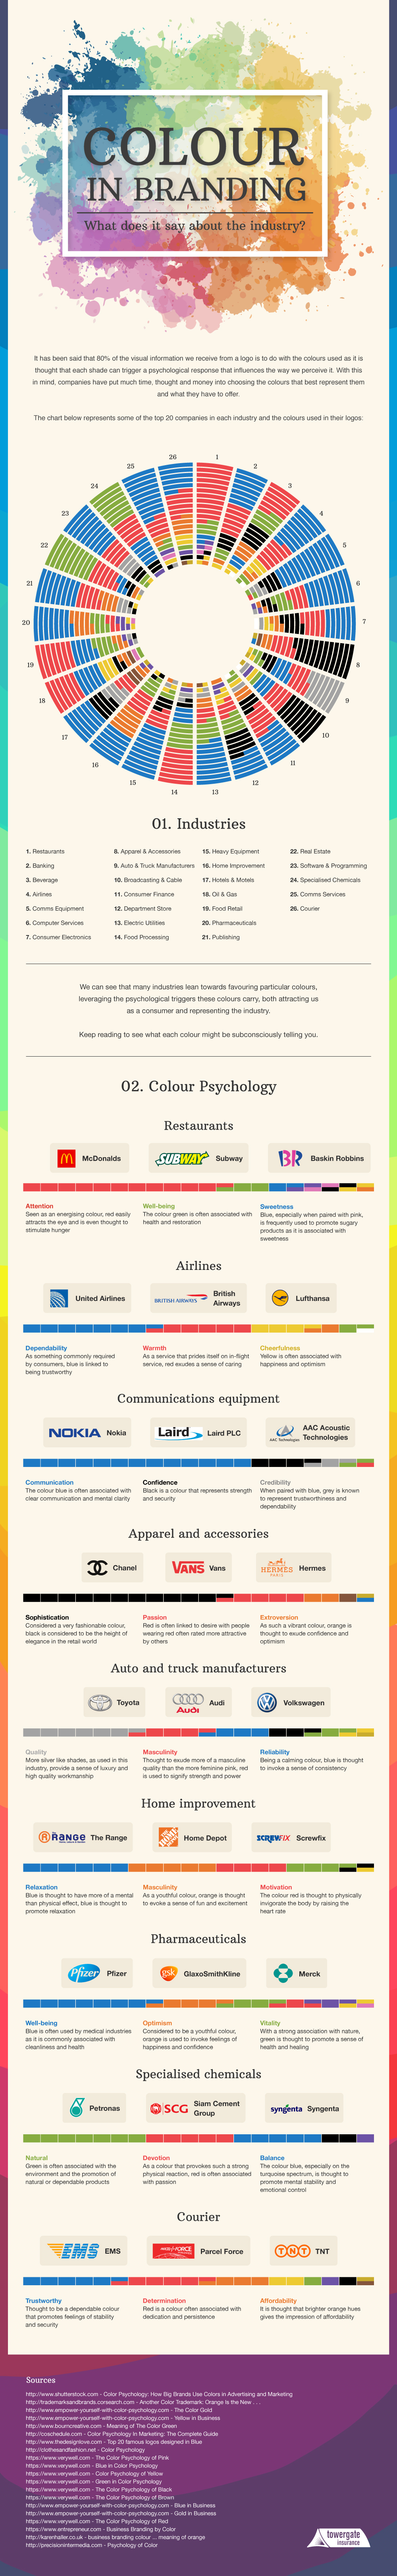
Today’s infographic from Towergate Insurance breaks down 26 industries by the colors used in top brands, providing an additional focus on industries such as autos, pharmaceutical, and apparel to identify the reasons why particular colors are used.
Here are some examples worth thinking about:
Autos
Based on the breakdown of the top 20 brands in the auto industry, it is interesting to see that silver is used with more prominence than in other sectors. Silver provides a sense of luxury and high-quality workmanship. Red and blue are also popular colors for brands in the auto sector. Red can symbol masculinity, while blue is supposed to represent reliability for brands like Volkswagen or Ford.
Pharma
Within the context of pharmaceutical branding, the concepts of health, vitality, and optimism are important. Blue, which is used as a color in branding for companies such as Pfizer, is meant to represent well-being. Meanwhile, GlaxoSmithKline’s orange is meant to be optimistic and energetic. Vitality or health can also be represented with green, which has a strong association with nature and healing.
Apparel
Fashion is dominated by companies that use black as a part of their branding. Of the top 20 apparel and accessory brands, 12 of them use black in their logos to evoke senses of sophistication, formality, style, or luxury.
These include companies such as Chanel, Zara, Adidas, Nike, Oakley, Burberry, Cartier, and many others.


Misc
How Hard Is It to Get Into an Ivy League School?
We detail the admission rates and average annual cost for Ivy League schools, as well as the median SAT scores required to be accepted.


How Hard Is It to Get Into an Ivy League School?
This was originally posted on our Voronoi app. Download the app for free on iOS or Android and discover incredible data-driven charts from a variety of trusted sources.
Ivy League institutions are renowned worldwide for their academic excellence and long-standing traditions. But how hard is it to get into one of the top universities in the U.S.?
In this graphic, we detail the admission rates and average annual cost for Ivy League schools, as well as the median SAT scores required to be accepted. The data comes from the National Center for Education Statistics and was compiled by 24/7 Wall St.
Note that “average annual cost” represents the net price a student pays after subtracting the average value of grants and/or scholarships received.
Harvard is the Most Selective
The SAT is a standardized test commonly used for college admissions in the United States. It’s taken by high school juniors and seniors to assess their readiness for college-level academic work.
When comparing SAT scores, Harvard and Dartmouth are among the most challenging universities to gain admission to. The median SAT scores for their students are 760 for reading and writing and 790 for math. Still, Harvard has half the admission rate (3.2%) compared to Dartmouth (6.4%).
| School | Admission rate (%) | SAT Score: Reading & Writing | SAT Score: Math | Avg Annual Cost* |
|---|---|---|---|---|
| Harvard University | 3.2 | 760 | 790 | $13,259 |
| Columbia University | 3.9 | 750 | 780 | $12,836 |
| Yale University | 4.6 | 760 | 780 | $16,341 |
| Brown University | 5.1 | 760 | 780 | $26,308 |
| Princeton University | 5.7 | 760 | 780 | $11,080 |
| Dartmouth College | 6.4 | 760 | 790 | $33,023 |
| University of Pennsylvania | 6.5 | 750 | 790 | $14,851 |
| Cornell University | 7.5 | 750 | 780 | $29,011 |
*Costs after receiving federal financial aid.
Additionally, Dartmouth has the highest average annual cost at $33,000. Princeton has the lowest at $11,100.
While student debt has surged in the United States in recent years, hitting $1.73 trillion in 2023, the worth of obtaining a degree from any of the schools listed surpasses mere academics. This is evidenced by the substantial incomes earned by former students.
Harvard grads, for example, have the highest average starting salary in the country, at $91,700.

-

 Real Estate2 weeks ago
Visualizing America’s Shortage of Affordable Homes
-

 Technology1 week ago
Ranked: Semiconductor Companies by Industry Revenue Share
-

 Money1 week ago
Which States Have the Highest Minimum Wage in America?
-

 Real Estate1 week ago
Ranked: The Most Valuable Housing Markets in America
-

 Business1 week ago
Charted: Big Four Market Share by S&P 500 Audits
-

 AI2 weeks ago
The Stock Performance of U.S. Chipmakers So Far in 2024
-

 Misc2 weeks ago
Almost Every EV Stock is Down After Q1 2024
-

 Money2 weeks ago
Where Does One U.S. Tax Dollar Go?