Markets
How Closely is Your State Economy Tied to Canada?
How Closely is Your State Economy Tied to Canada?
With negotiations around NAFTA continuing on into this week, many Americans are rightfully wondering how major changes to the deal could impact their lives.
Discussions are still early, and it’s tough to predict the exact policies that will be affected until negotiations reach their peak. However, until that point, there is one simple barometer that can give you an idea of how you may be affected: how much business does your state do with Canada, and how much is with Mexico?
States Tied to Canada
Today’s visualization from HowMuch.net focuses specifically on how close each state economy is tied to Canada.
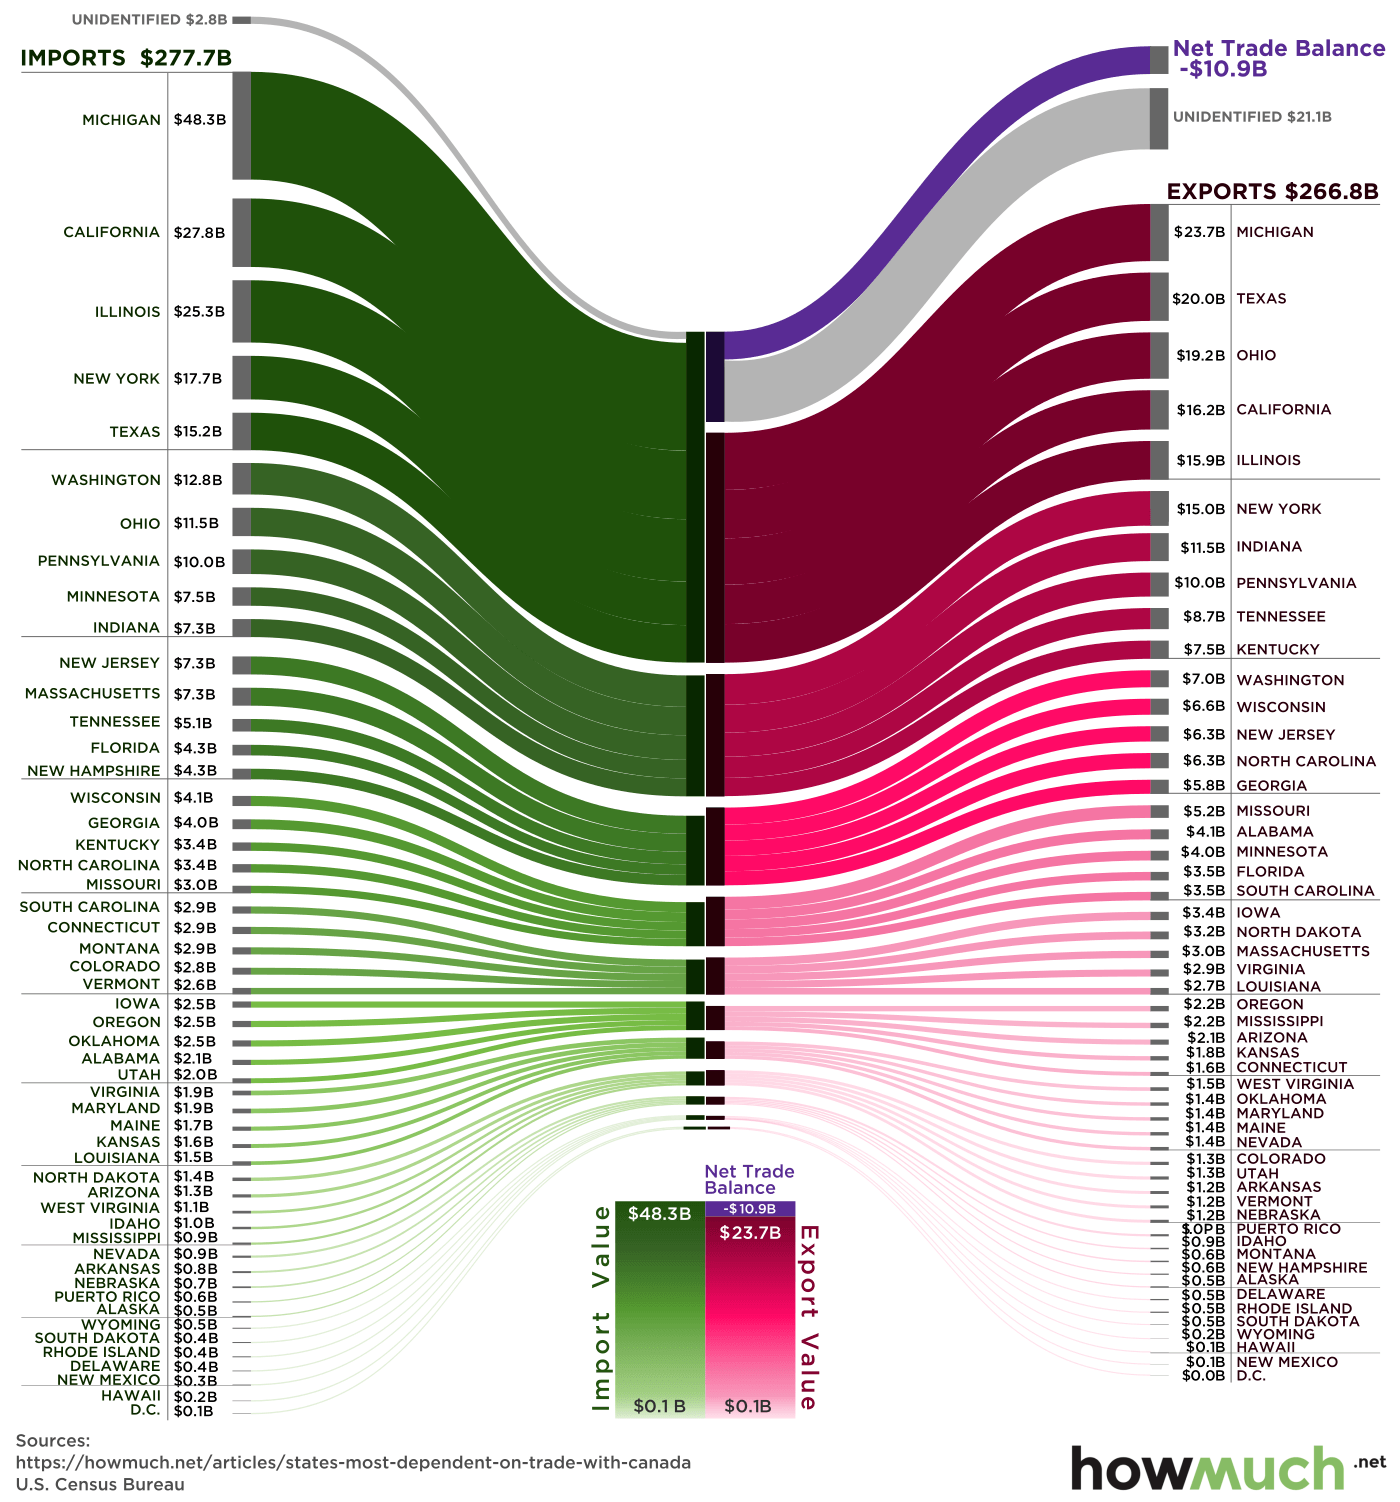
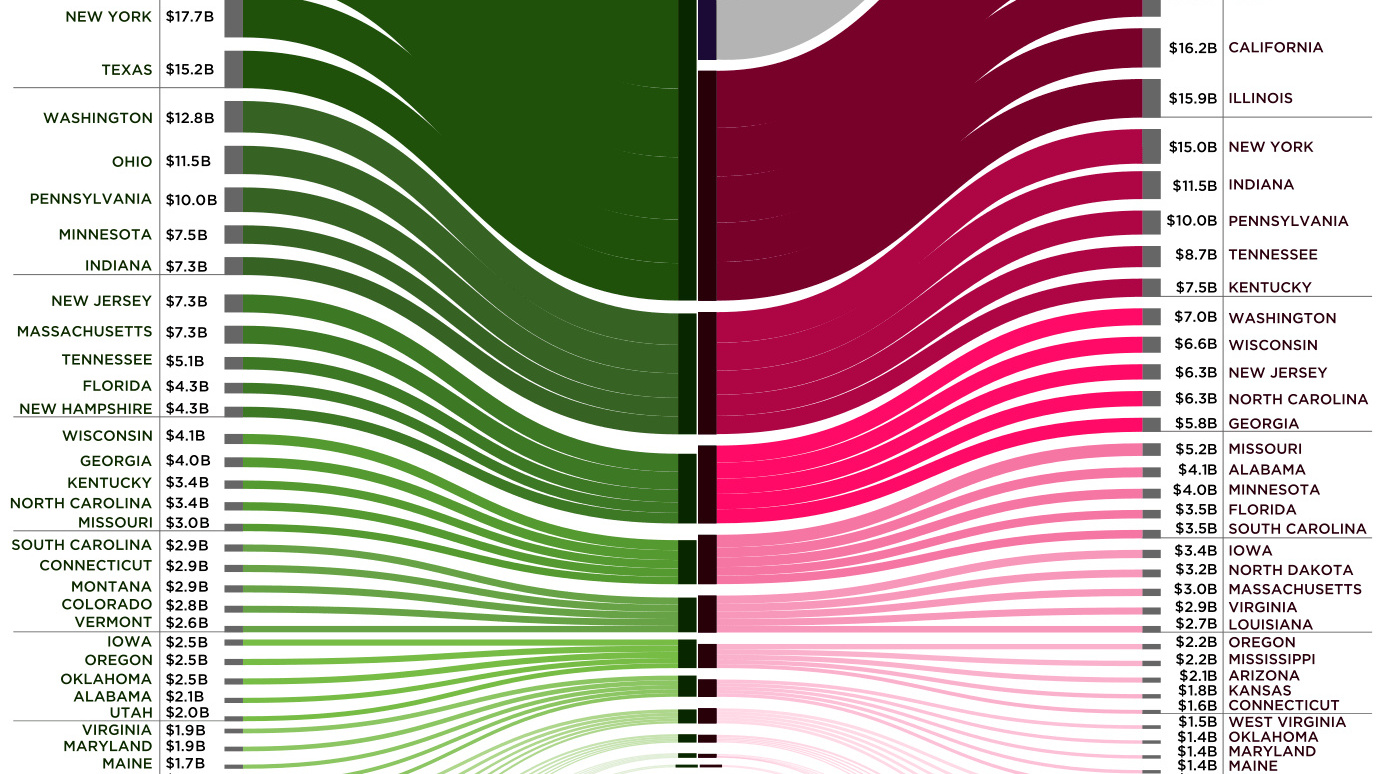
Using a flow diagram, it breaks down $544.9 billion of bilateral trade into the imports and exports of states, ranked by the total amount of goods sent or received from their neighbors to the north.
Here’s a breakdown of the states that export the most to Canada, both in percentage terms and dollars:
| Exports to Canada, by % | Exports to Canada, by $ | |||||
|---|---|---|---|---|---|---|
| Rank | State | Exports (%) | Rank | State | Exports ($) | |
| #1 | North Dakota | 82.5% | #1 | Michigan | $23.7B | |
| #2 | Maine | 47.5% | #2 | Texas | $20.0B | |
| #3 | Montana | 46.7% | #3 | Ohio | $19.2B | |
| #4 | Michigan | 43.3% | #4 | California | $16.2B | |
| #5 | Vermont | 39.7% | #5 | Illinois | $15.9B | |
| #6 | Ohio | 39.0% | #6 | New York | $15.0B | |
| #7 | Missouri | 37.6% | #7 | Indiana | $11.5B | |
| #8 | South Dakota | 37.1% | #8 | Pennsylvania | $10.0B | |
| #9 | Indiana | 33.2% | #9 | Tennessee | $8.7B | |
| #10 | Wisconsin | 31.4% | #10 | Kentucky | $7.5B | |
On average, 15.0% of all U.S. international trade is with Canada – but as you can see above, some states are clearly more reliant on this trade than others.
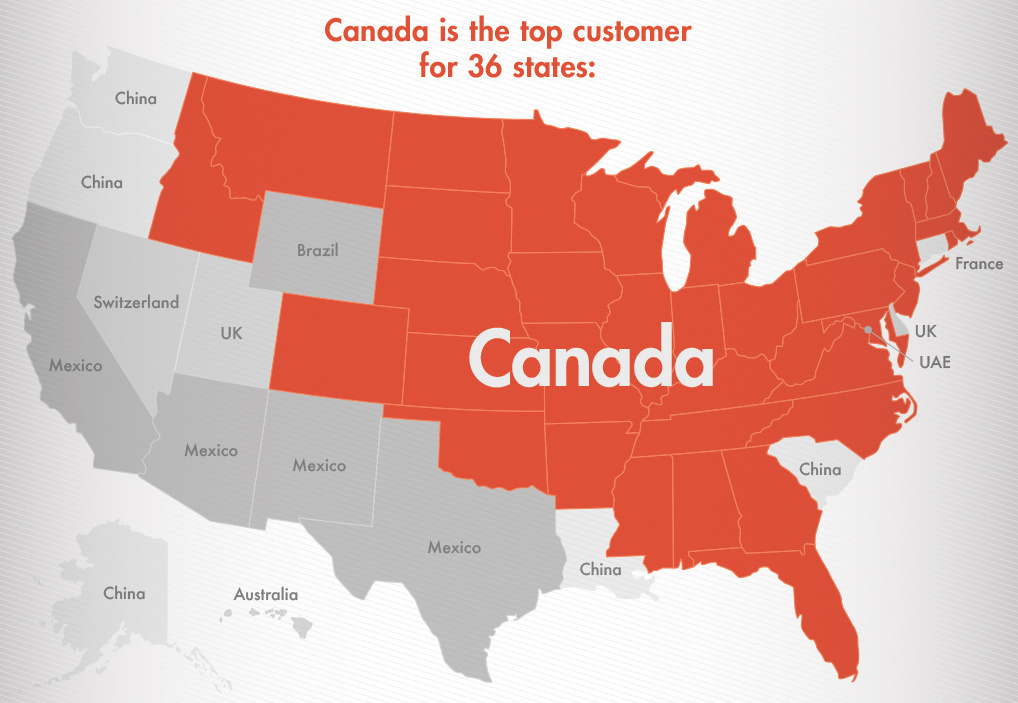
To put this in wider perspective, here’s a map we published as a part of a post on the world’s closest trade relationship. It shows that Canada is the top international destination of exports for 36 different states:
Imported from up North
Canada also sends a great deal of goods to the United States, as well.
The following states are the ones that import the most goods from Canada, and any changes to NAFTA could potentially impact these supply chains. If prices increase through tariffs, these businesses would have to either suck up the additional costs, or seek alternative inputs from other places.
| Imports from Canada, by % | Imports from Canada, by $ | |||||
|---|---|---|---|---|---|---|
| Rank | State | Imports (%) | Rank | State | Imports ($) | |
| #1 | Montana | 82.4% | #1 | Michigan | $48.3B | |
| #2 | Vermont | 69.1% | #2 | California | $27.8B | |
| #3 | Wyoming | 61.8% | #3 | Illinois | $25.3B | |
| #4 | North Dakota | 53.2% | #4 | New York | $17.6B | |
| #5 | Maine | 50.9% | #5 | Texas | $15.2B | |
| #6 | New Hampshire | 49.6% | #6 | Washington | $12.6B | |
| #7 | Michigan | 35.8% | #7 | Ohio | $11.5B | |
| #8 | South Dakota | 35.1% | #8 | Pennsylvania | $10.0B | |
| #9 | Virginia | 33.8% | #9 | Minnesota | $7.5B | |
| #10 | Oklahoma | 29.9% | #10 | New Jersey | $7.3B | |
Putting it Together
In percentage terms, northern states like North Dakota, Maine, Michigan, Vermont, and Montana are the most reliant on Canada for international trade both ways.
In many of those states, Canadian trade also tends to be large as a percentage of Gross State Product (GSP): Michigan (15%), Vermont (14%), Montana (9%), North Dakota (8%), and New Hampshire (7%) are the most affected using this criteria. Meanwhile, states like Illinois, Indiana, Ohio, Kentucky, and Maine each trade with Canada for 6% of their total GSP value.
By using dollars as a metric, Michigan is the state that will be impacted the most – it imports $48.3 billion, while exporting $23.7 billion to Canada.


Markets
U.S. Debt Interest Payments Reach $1 Trillion
U.S. debt interest payments have surged past the $1 trillion dollar mark, amid high interest rates and an ever-expanding debt burden.


U.S. Debt Interest Payments Reach $1 Trillion
This was originally posted on our Voronoi app. Download the app for free on iOS or Android and discover incredible data-driven charts from a variety of trusted sources.
The cost of paying for America’s national debt crossed the $1 trillion dollar mark in 2023, driven by high interest rates and a record $34 trillion mountain of debt.
Over the last decade, U.S. debt interest payments have more than doubled amid vast government spending during the pandemic crisis. As debt payments continue to soar, the Congressional Budget Office (CBO) reported that debt servicing costs surpassed defense spending for the first time ever this year.
This graphic shows the sharp rise in U.S. debt payments, based on data from the Federal Reserve.
A $1 Trillion Interest Bill, and Growing
Below, we show how U.S. debt interest payments have risen at a faster pace than at another time in modern history:
| Date | Interest Payments | U.S. National Debt |
|---|---|---|
| 2023 | $1.0T | $34.0T |
| 2022 | $830B | $31.4T |
| 2021 | $612B | $29.6T |
| 2020 | $518B | $27.7T |
| 2019 | $564B | $23.2T |
| 2018 | $571B | $22.0T |
| 2017 | $493B | $20.5T |
| 2016 | $460B | $20.0T |
| 2015 | $435B | $18.9T |
| 2014 | $442B | $18.1T |
| 2013 | $425B | $17.2T |
| 2012 | $417B | $16.4T |
| 2011 | $433B | $15.2T |
| 2010 | $400B | $14.0T |
| 2009 | $354B | $12.3T |
| 2008 | $380B | $10.7T |
| 2007 | $414B | $9.2T |
| 2006 | $387B | $8.7T |
| 2005 | $355B | $8.2T |
| 2004 | $318B | $7.6T |
| 2003 | $294B | $7.0T |
| 2002 | $298B | $6.4T |
| 2001 | $318B | $5.9T |
| 2000 | $353B | $5.7T |
| 1999 | $353B | $5.8T |
| 1998 | $360B | $5.6T |
| 1997 | $368B | $5.5T |
| 1996 | $362B | $5.3T |
| 1995 | $357B | $5.0T |
| 1994 | $334B | $4.8T |
| 1993 | $311B | $4.5T |
| 1992 | $306B | $4.2T |
| 1991 | $308B | $3.8T |
| 1990 | $298B | $3.4T |
| 1989 | $275B | $3.0T |
| 1988 | $254B | $2.7T |
| 1987 | $240B | $2.4T |
| 1986 | $225B | $2.2T |
| 1985 | $219B | $1.9T |
| 1984 | $205B | $1.7T |
| 1983 | $176B | $1.4T |
| 1982 | $157B | $1.2T |
| 1981 | $142B | $1.0T |
| 1980 | $113B | $930.2B |
| 1979 | $96B | $845.1B |
| 1978 | $84B | $789.2B |
| 1977 | $69B | $718.9B |
| 1976 | $61B | $653.5B |
| 1975 | $55B | $576.6B |
| 1974 | $50B | $492.7B |
| 1973 | $45B | $469.1B |
| 1972 | $39B | $448.5B |
| 1971 | $36B | $424.1B |
| 1970 | $35B | $389.2B |
| 1969 | $30B | $368.2B |
| 1968 | $25B | $358.0B |
| 1967 | $23B | $344.7B |
| 1966 | $21B | $329.3B |
Interest payments represent seasonally adjusted annual rate at the end of Q4.
At current rates, the U.S. national debt is growing by a remarkable $1 trillion about every 100 days, equal to roughly $3.6 trillion per year.
As the national debt has ballooned, debt payments even exceeded Medicaid outlays in 2023—one of the government’s largest expenditures. On average, the U.S. spent more than $2 billion per day on interest costs last year. Going further, the U.S. government is projected to spend a historic $12.4 trillion on interest payments over the next decade, averaging about $37,100 per American.
Exacerbating matters is that the U.S. is running a steep deficit, which stood at $1.1 trillion for the first six months of fiscal 2024. This has accelerated due to the 43% increase in debt servicing costs along with a $31 billion dollar increase in defense spending from a year earlier. Additionally, a $30 billion increase in funding for the Federal Deposit Insurance Corporation in light of the regional banking crisis last year was a major contributor to the deficit increase.
Overall, the CBO forecasts that roughly 75% of the federal deficit’s increase will be due to interest costs by 2034.

-

 Real Estate2 weeks ago
Visualizing America’s Shortage of Affordable Homes
-

 Technology1 week ago
Ranked: Semiconductor Companies by Industry Revenue Share
-

 Money1 week ago
Which States Have the Highest Minimum Wage in America?
-

 Real Estate1 week ago
Ranked: The Most Valuable Housing Markets in America
-

 Business2 weeks ago
Charted: Big Four Market Share by S&P 500 Audits
-

 AI2 weeks ago
The Stock Performance of U.S. Chipmakers So Far in 2024
-

 Misc2 weeks ago
Almost Every EV Stock is Down After Q1 2024
-

 Money2 weeks ago
Where Does One U.S. Tax Dollar Go?