Markets
Which States Get the Most Chinese Investment?
Which States Get the Most Chinese Investment?
Part of being a global superpower is having some money to throw around.
Want to fund a giant 80 million person megacity in the Pearl River Delta for $322 billion? Piece of cake.
Re-build the Silk Road for up to $1 trillion? Not an issue.
But China doesn’t only show off its deep pockets domestically. The country has also been extremely active on the global market, buying up everything from natural resources in Africa to luxurious real estate in Manhattan. In total, Chinese companies have spent over $1 trillion on overseas investment over the last decade, and this has only accelerated in recent years as investors seek to acquire safe haven assets abroad.
America First?
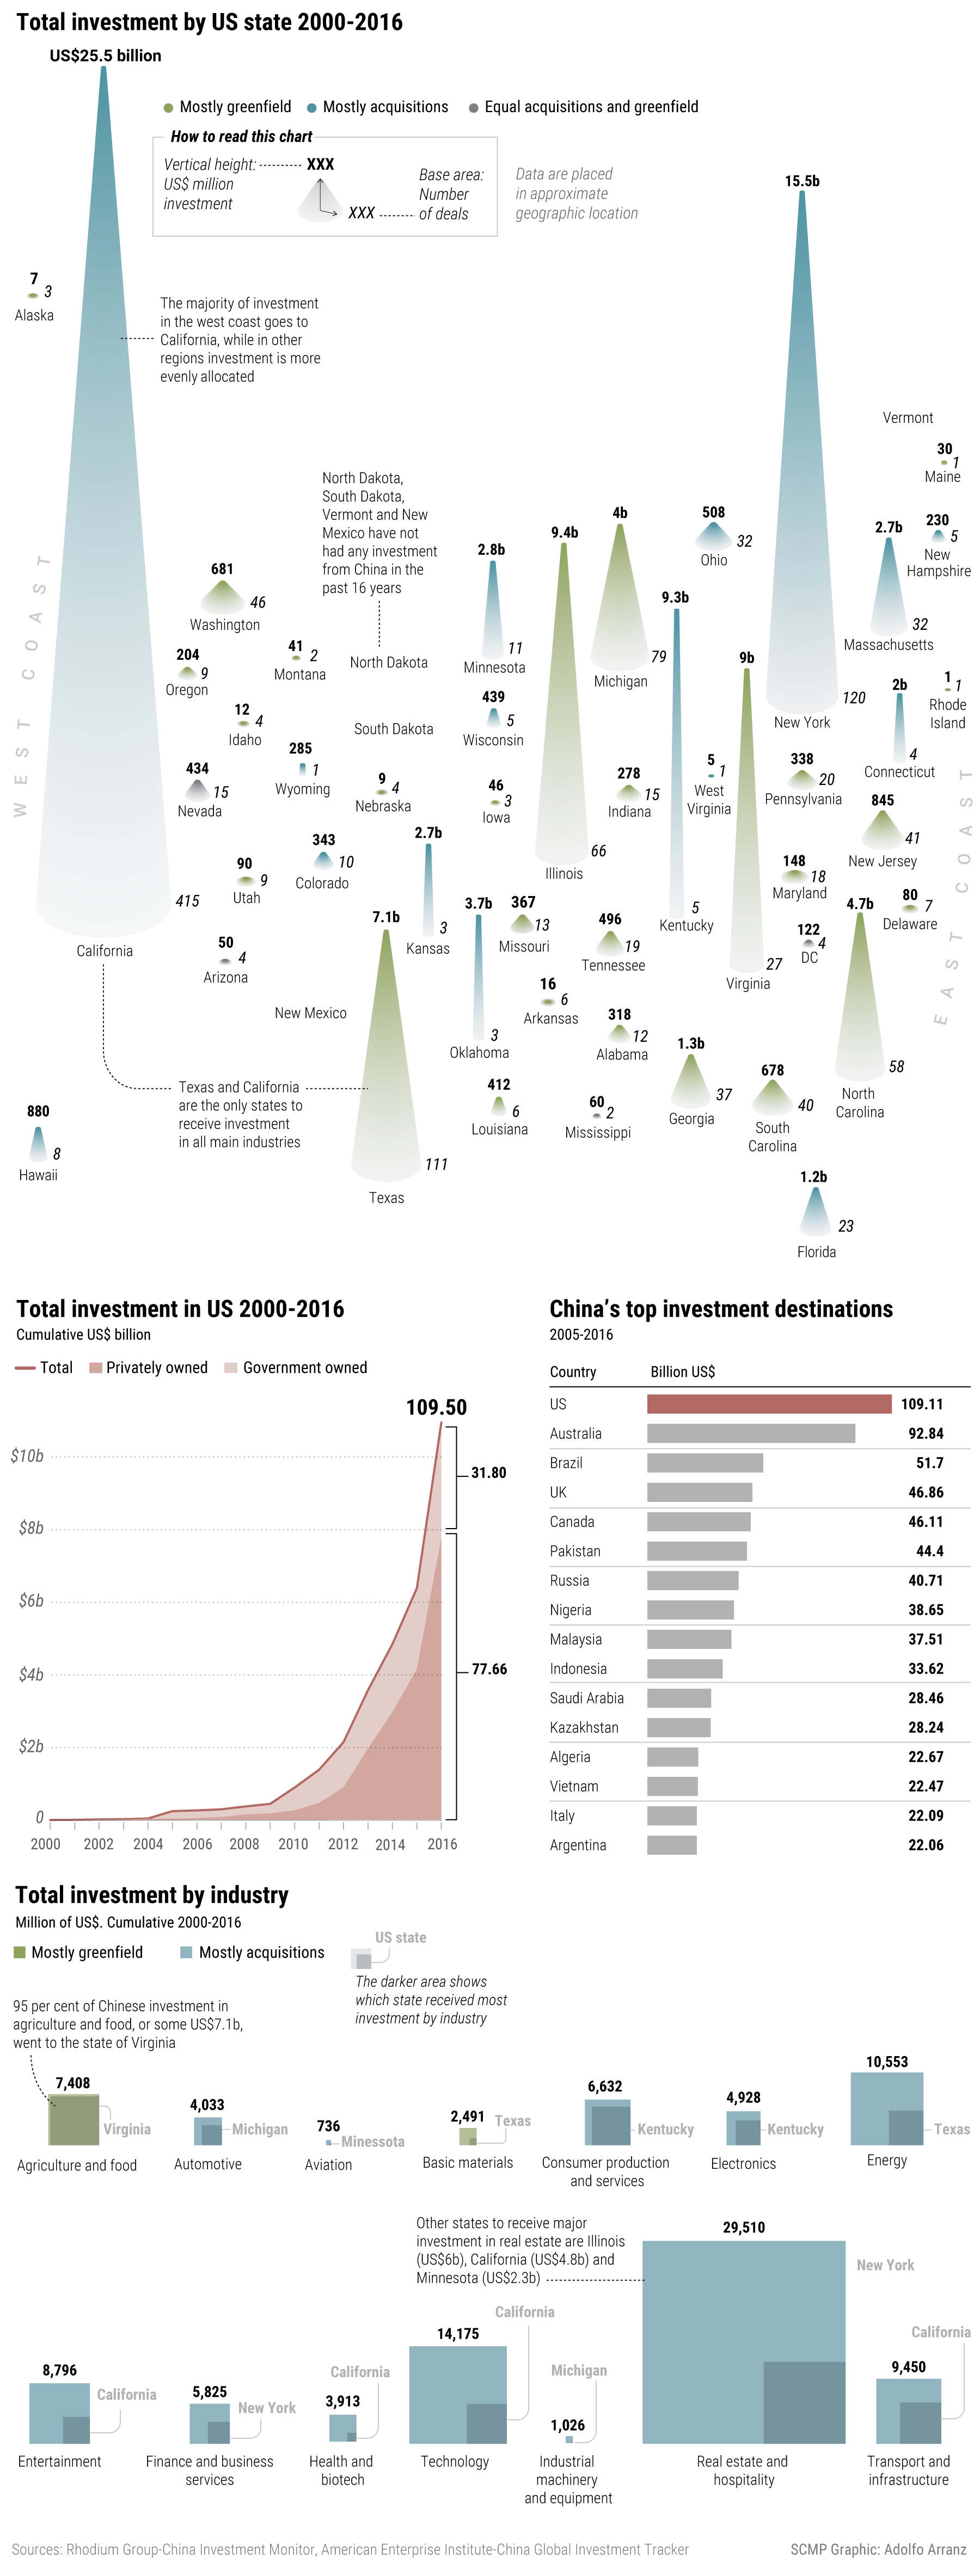
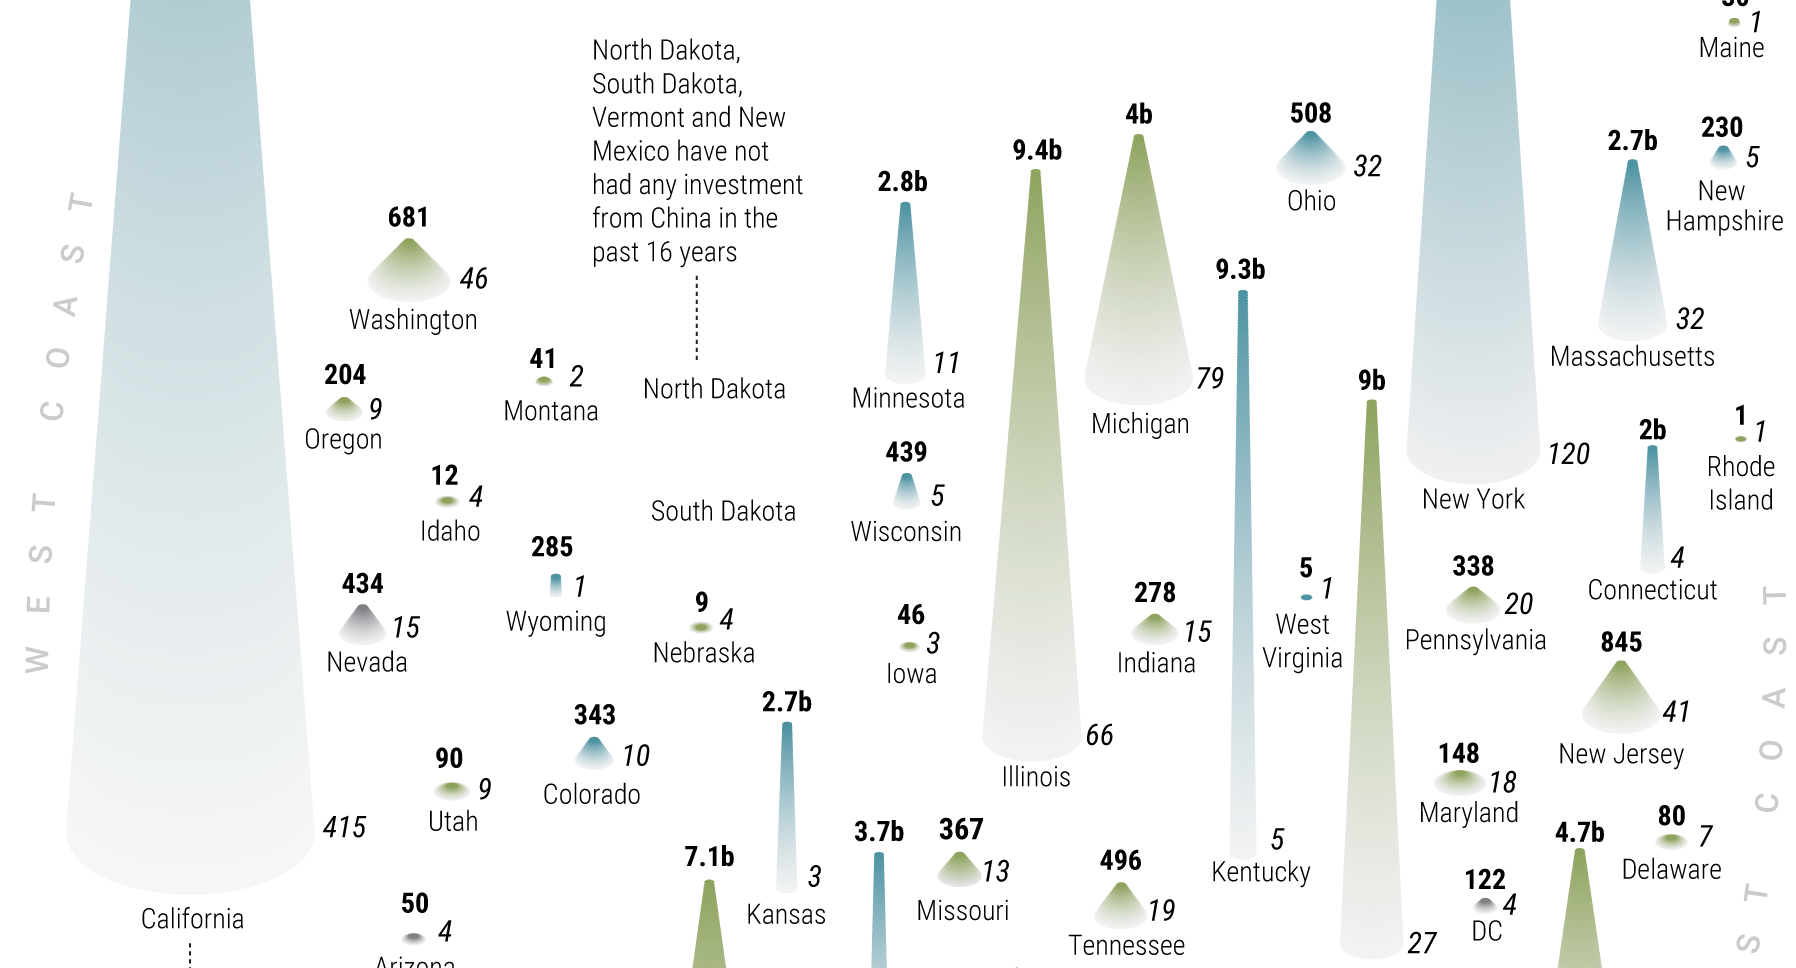
Today’s infographic comes from SCMP, and it shows where Chinese overseas investment has been going, with a particular focus on the United States between 2000 and 2016.
Cumulatively, China has put $109.5 billion into the U.S. during this time period, with about 70% of that money coming from private companies. The sectors that have received the most Chinese investment so far include real estate and hospitality ($29.5 billion), information technology ($14.2 billion), energy ($13.4 billion), and entertainment ($8.8 billion).
According to Forbes, here were the five biggest investments made in the U.S. in 2016:
1. HNA Tourism Group gets 25% stake in Hilton for $6.5 billion
This deal helps Chinese conglomerate HNA and Hilton to take advantage of China’s growing tourism market both in China and internationally.
2. Tianjin Tianhai buys Ingram Micro for $6.1 billion
This is the biggest purchase of an American information technology company by a Chinese firm so far. Ingram Micro is the world’s largest wholesaler in technology products and services.
3. Haier Group buys GE’s appliance business for $5.6 billion
Haier is a massive consumer electronics and appliances company in China, with roughly $30 billion of revenue per year. However, the company has yet to make inroads in the North American market. This made buying GE’s appliances division a very strategic opportunity for the company.
4. Anbang Insurance pays $5.5 billion for Strategic Hotels And Resorts
One of China’s largest insurance companies bought 15 luxury properties, including the Four Seasons in Washington, D.C. and the JW Marriot Essex House in New York. The deal was originally valued at $6.5 billion, but one of the hotels was dropped after security concerns were raised due to its proximity to a U.S. naval base in San Diego. That property is worth approximately $1 billion.
5. Dalian Wanda buys Legendary Entertainment for $3.5 billion
Legendary Entertainment is a Hollywood production company that has the rights to popular films such as The Dark Knight, Inception, Jurassic World and Straight Outta Compton.


Markets
U.S. Debt Interest Payments Reach $1 Trillion
U.S. debt interest payments have surged past the $1 trillion dollar mark, amid high interest rates and an ever-expanding debt burden.


U.S. Debt Interest Payments Reach $1 Trillion
This was originally posted on our Voronoi app. Download the app for free on iOS or Android and discover incredible data-driven charts from a variety of trusted sources.
The cost of paying for America’s national debt crossed the $1 trillion dollar mark in 2023, driven by high interest rates and a record $34 trillion mountain of debt.
Over the last decade, U.S. debt interest payments have more than doubled amid vast government spending during the pandemic crisis. As debt payments continue to soar, the Congressional Budget Office (CBO) reported that debt servicing costs surpassed defense spending for the first time ever this year.
This graphic shows the sharp rise in U.S. debt payments, based on data from the Federal Reserve.
A $1 Trillion Interest Bill, and Growing
Below, we show how U.S. debt interest payments have risen at a faster pace than at another time in modern history:
| Date | Interest Payments | U.S. National Debt |
|---|---|---|
| 2023 | $1.0T | $34.0T |
| 2022 | $830B | $31.4T |
| 2021 | $612B | $29.6T |
| 2020 | $518B | $27.7T |
| 2019 | $564B | $23.2T |
| 2018 | $571B | $22.0T |
| 2017 | $493B | $20.5T |
| 2016 | $460B | $20.0T |
| 2015 | $435B | $18.9T |
| 2014 | $442B | $18.1T |
| 2013 | $425B | $17.2T |
| 2012 | $417B | $16.4T |
| 2011 | $433B | $15.2T |
| 2010 | $400B | $14.0T |
| 2009 | $354B | $12.3T |
| 2008 | $380B | $10.7T |
| 2007 | $414B | $9.2T |
| 2006 | $387B | $8.7T |
| 2005 | $355B | $8.2T |
| 2004 | $318B | $7.6T |
| 2003 | $294B | $7.0T |
| 2002 | $298B | $6.4T |
| 2001 | $318B | $5.9T |
| 2000 | $353B | $5.7T |
| 1999 | $353B | $5.8T |
| 1998 | $360B | $5.6T |
| 1997 | $368B | $5.5T |
| 1996 | $362B | $5.3T |
| 1995 | $357B | $5.0T |
| 1994 | $334B | $4.8T |
| 1993 | $311B | $4.5T |
| 1992 | $306B | $4.2T |
| 1991 | $308B | $3.8T |
| 1990 | $298B | $3.4T |
| 1989 | $275B | $3.0T |
| 1988 | $254B | $2.7T |
| 1987 | $240B | $2.4T |
| 1986 | $225B | $2.2T |
| 1985 | $219B | $1.9T |
| 1984 | $205B | $1.7T |
| 1983 | $176B | $1.4T |
| 1982 | $157B | $1.2T |
| 1981 | $142B | $1.0T |
| 1980 | $113B | $930.2B |
| 1979 | $96B | $845.1B |
| 1978 | $84B | $789.2B |
| 1977 | $69B | $718.9B |
| 1976 | $61B | $653.5B |
| 1975 | $55B | $576.6B |
| 1974 | $50B | $492.7B |
| 1973 | $45B | $469.1B |
| 1972 | $39B | $448.5B |
| 1971 | $36B | $424.1B |
| 1970 | $35B | $389.2B |
| 1969 | $30B | $368.2B |
| 1968 | $25B | $358.0B |
| 1967 | $23B | $344.7B |
| 1966 | $21B | $329.3B |
Interest payments represent seasonally adjusted annual rate at the end of Q4.
At current rates, the U.S. national debt is growing by a remarkable $1 trillion about every 100 days, equal to roughly $3.6 trillion per year.
As the national debt has ballooned, debt payments even exceeded Medicaid outlays in 2023—one of the government’s largest expenditures. On average, the U.S. spent more than $2 billion per day on interest costs last year. Going further, the U.S. government is projected to spend a historic $12.4 trillion on interest payments over the next decade, averaging about $37,100 per American.
Exacerbating matters is that the U.S. is running a steep deficit, which stood at $1.1 trillion for the first six months of fiscal 2024. This has accelerated due to the 43% increase in debt servicing costs along with a $31 billion dollar increase in defense spending from a year earlier. Additionally, a $30 billion increase in funding for the Federal Deposit Insurance Corporation in light of the regional banking crisis last year was a major contributor to the deficit increase.
Overall, the CBO forecasts that roughly 75% of the federal deficit’s increase will be due to interest costs by 2034.

-

 Real Estate2 weeks ago
Visualizing America’s Shortage of Affordable Homes
-

 Technology1 week ago
Ranked: Semiconductor Companies by Industry Revenue Share
-

 Money1 week ago
Which States Have the Highest Minimum Wage in America?
-

 Real Estate1 week ago
Ranked: The Most Valuable Housing Markets in America
-

 Business2 weeks ago
Charted: Big Four Market Share by S&P 500 Audits
-

 AI2 weeks ago
The Stock Performance of U.S. Chipmakers So Far in 2024
-

 Misc2 weeks ago
Almost Every EV Stock is Down After Q1 2024
-

 Money2 weeks ago
Where Does One U.S. Tax Dollar Go?