Misc
Animation: China’s Rapid Transit Boom (1990 – 2020)
After decades of hyper-growth and worsening pollution, China has fully embraced rapid transit as a way to keep cities moving. By 2020, China aims to have 7,000 km (4,300 mi.) of rapid transit lines, more than five times what exists in the U.S. today.
The following animation from Peter Dovak shows this rapid transit revolution playing out by year:
MIND THE GAP
In the above animation, there’s a distinct uptick in the number of projects started after 2004. It was in this year that the government lifted a ban on new metro construction, after worsening congestion and pollution caused the government to rethink their stance. There has been a rapid transit boom in the country ever since.
Soon, minimum population requirements for cities looking to build subway systems will be halved from 3 million to 1.5 million, and this move is expected to set off an even bigger wave of infrastructure investment in cities throughout the country.
RISING RATIOS
Hundreds of kilometers of track are being added each year. As a result of this unparalleled pace of metro construction, China’s ratio of Rapid Transit to Residents (RTR) has risen steeply over the last 15 years.
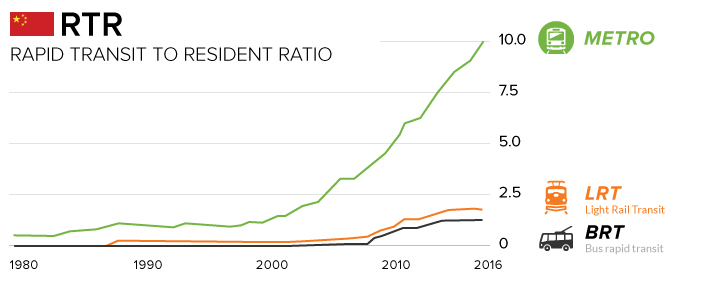
RTR is a ratio that compares the length of rapid transit lines (measured in kilometers) with the country’s urban population (measured in millions of people). As you can see, China is making great strides in building urban transit networks, though it is still catching up to countries like Germany, which has a RTR of 81.
Chinese cities have a blend of attributes that make constructing metro lines an appealing option: fewer regulatory hurdles, a low cost of labor, and a high-density urban fabric. Also, because transit is treated as an essential public service (i.e. not expected to be profitable), China’s metros provide affordable mobility to its citizens. Even with Beijing’s recent metro fare increase, most rides only cost about ¥3 to ¥8, or $0.45 to $1.45.
Shanghai is now home to the longest metro system by route length, and the Beijing Subway has the highest ridership in the world. Not bad for cities that lacked any substantive transit system until the 1990s.

By 2020, China is expected to have 220+ cities with over a million inhabitants, so as long as the government can continue to provide the resources and funding to expanding transit networks, the building boom will likely continue unabated.


Maps
The Largest Earthquakes in the New York Area (1970-2024)
The earthquake that shook buildings across New York in April 2024 was the third-largest quake in the Northeast U.S. over the past 50 years.


The Largest Earthquakes in the New York Area
This was originally posted on our Voronoi app. Download the app for free on Apple or Android and discover incredible data-driven charts from a variety of trusted sources.
The 4.8 magnitude earthquake that shook buildings across New York on Friday, April 5th, 2024 was the third-largest quake in the U.S. Northeast area over the past 50 years.
In this map, we illustrate earthquakes with a magnitude of 4.0 or greater recorded in the Northeastern U.S. since 1970, according to the United States Geological Survey (USGS).
Shallow Quakes and Older Buildings
The earthquake that struck the U.S. Northeast in April 2024 was felt by millions of people from Washington, D.C., to north of Boston. It even caused a full ground stop at Newark Airport.
The quake, occurring just 5 km beneath the Earth’s surface, was considered shallow, which is what contributed to more intense shaking at the surface.
According to the USGS, rocks in the eastern U.S. are significantly older, denser, and harder than those on the western side, compressed by time. This makes them more efficient conduits for seismic energy. Additionally, buildings in the Northeast tend to be older and may not adhere to the latest earthquake codes.
Despite disrupting work and school life, the earthquake was considered minor, according to the Michigan Technological University magnitude scale:
| Magnitude | Earthquake Effects | Estimated Number Each Year |
|---|---|---|
| 2.5 or less | Usually not felt, but can be recorded by seismograph. | Millions |
| 2.5 to 5.4 | Often felt, but only causes minor damage. | 500,000 |
| 5.5 to 6.0 | Slight damage to buildings and other structures. | 350 |
| 6.1 to 6.9 | May cause a lot of damage in very populated areas. | 100 |
| 7.0 to 7.9 | Major earthquake. Serious damage. | 10-15 |
| 8.0 or greater | Great earthquake. Can totally destroy communities near the epicenter. | One every year or two |
The largest earthquake felt in the area over the past 50 years was a 5.3 magnitude quake that occurred in Au Sable Forks, New York, in 2002. It damaged houses and cracked roads in a remote corner of the Adirondack Mountains, but caused no injuries.
| Date | Magnitude | Location | State |
|---|---|---|---|
| April 20, 2002 | 5.3 | Au Sable Forks | New York |
| October 7, 1983 | 5.1 | Newcomb | New York |
| April 5, 2024 | 4.8 | Whitehouse Station | New Jersey |
| October 16, 2012 | 4.7 | Hollis Center | Maine |
| January 16, 1994 | 4.6 | Sinking Spring | Pennsylvania |
| January 19, 1982 | 4.5 | Sanbornton | New Hampshire |
| September 25, 1998 | 4.5 | Adamsville | Pennsylvania |
| June 9, 1975 | 4.2 | Altona | New York |
| May 29, 1983 | 4.2 | Peru | Maine |
| April 23, 1984 | 4.2 | Conestoga | Pennsylvania |
| January 16, 1994 | 4.2 | Sinking Spring | Pennsylvania |
| November 3, 1975 | 4 | Long Lake | New York |
| June 17, 1991 | 4 | Worcester | New York |
The largest earthquake in U.S. history, however, was the 1964 Good Friday quake in Alaska, measuring 9.2 magnitude and killing 131 people.

-
 Money2 weeks ago
Visualizing the Growth of $100, by Asset Class (1970-2023)
-

 Money1 week ago
Where Does One U.S. Tax Dollar Go?
-

 Green2 weeks ago
Ranked: Top Countries by Total Forest Loss Since 2001
-

 Real Estate2 weeks ago
Visualizing America’s Shortage of Affordable Homes
-

 Maps2 weeks ago
Mapped: Average Wages Across Europe
-

 Mining2 weeks ago
Charted: The Value Gap Between the Gold Price and Gold Miners
-

 Demographics2 weeks ago
Visualizing the Size of the Global Senior Population
-

 Misc2 weeks ago
Tesla Is Once Again the World’s Best-Selling EV Company