Markets
Charting the Rise and Fall of the Global Luxury Goods Market


The Rise and Fall of the Global Luxury Goods Market
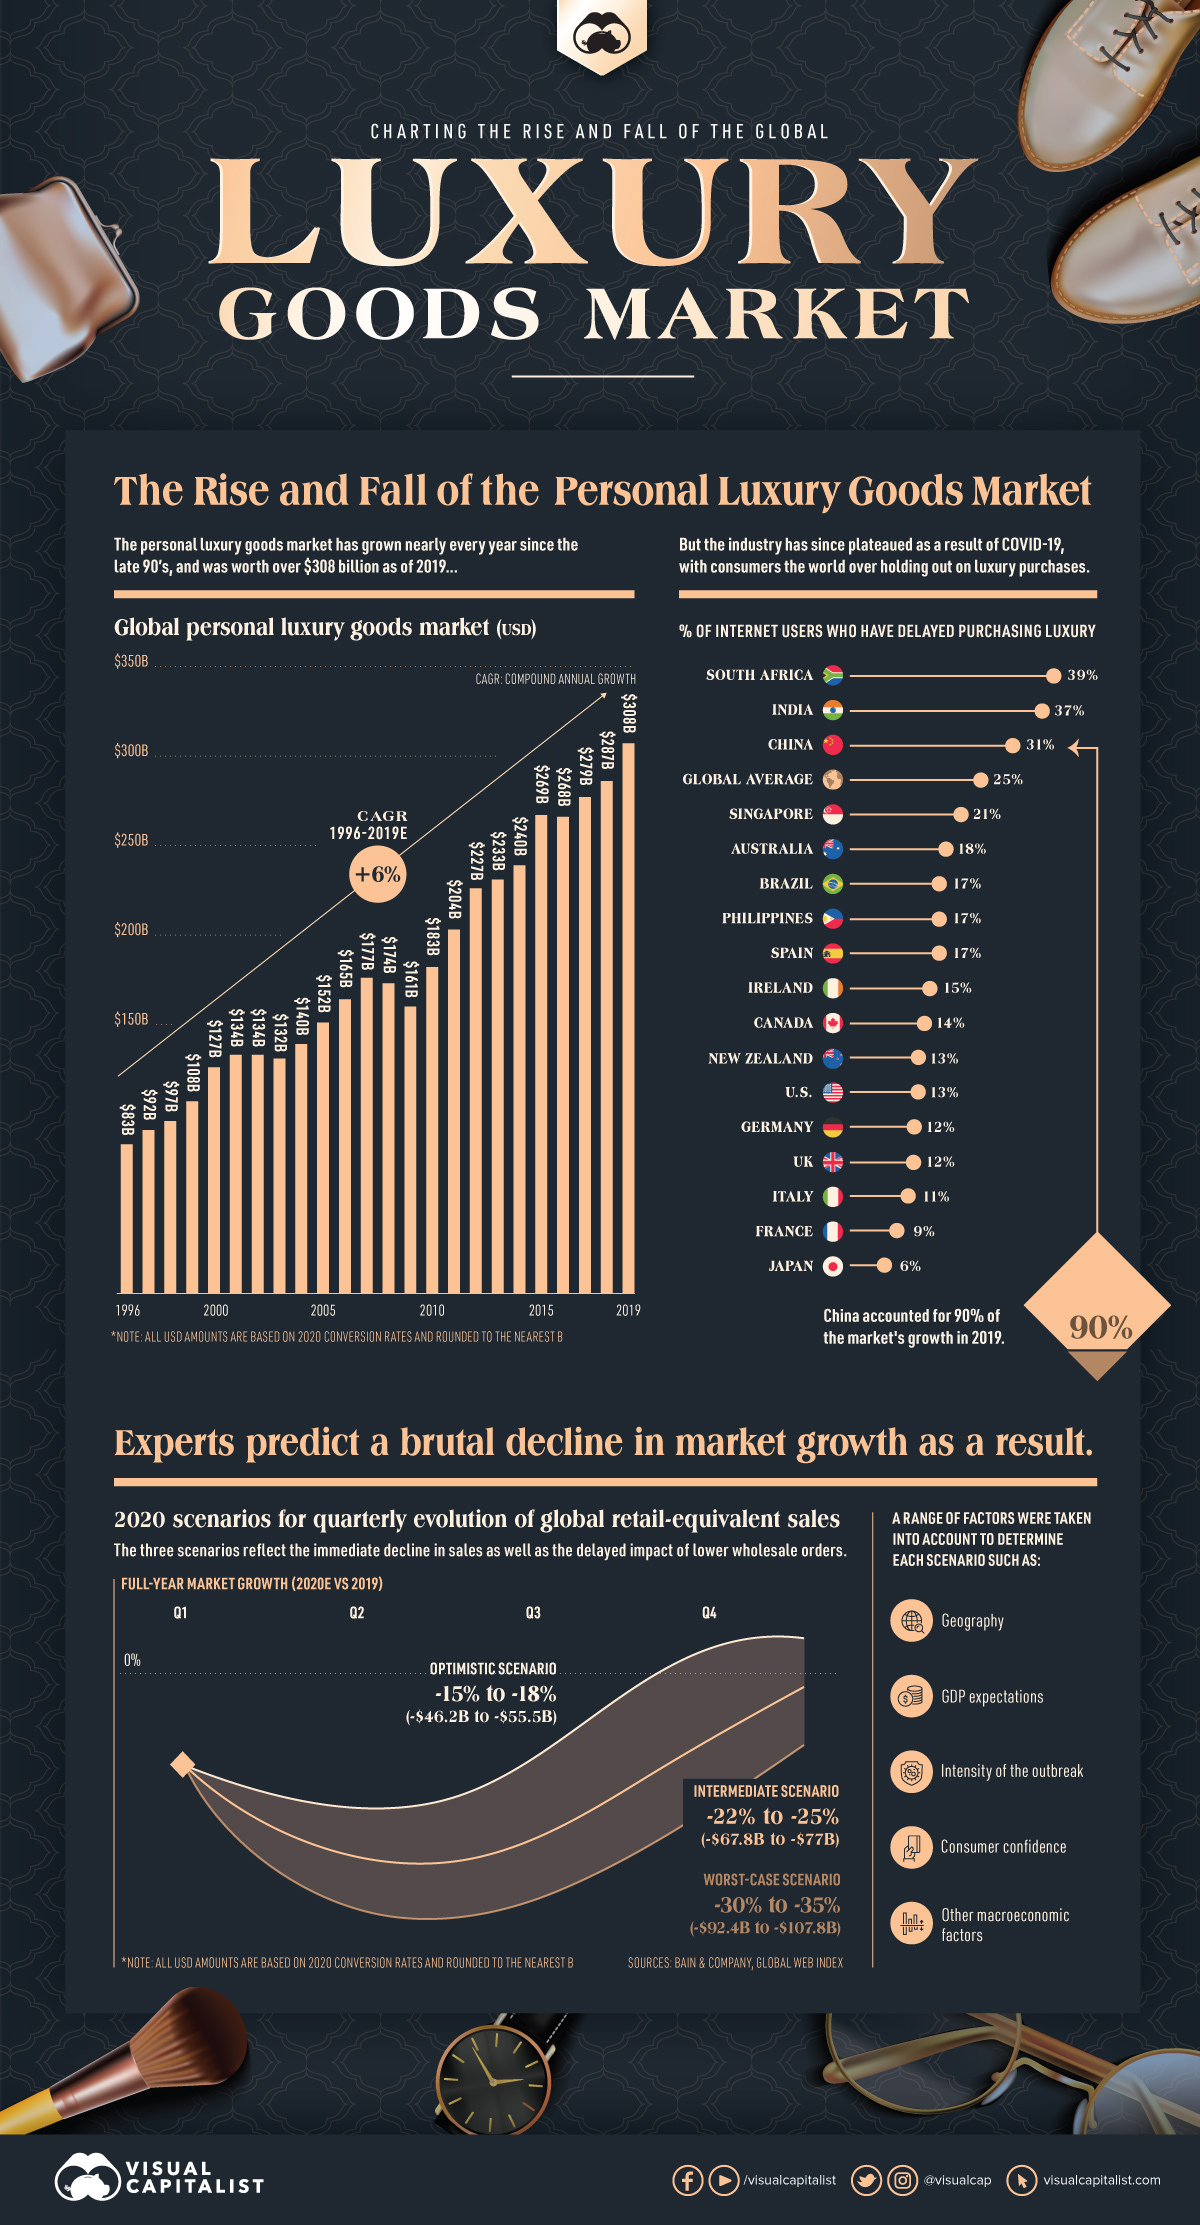
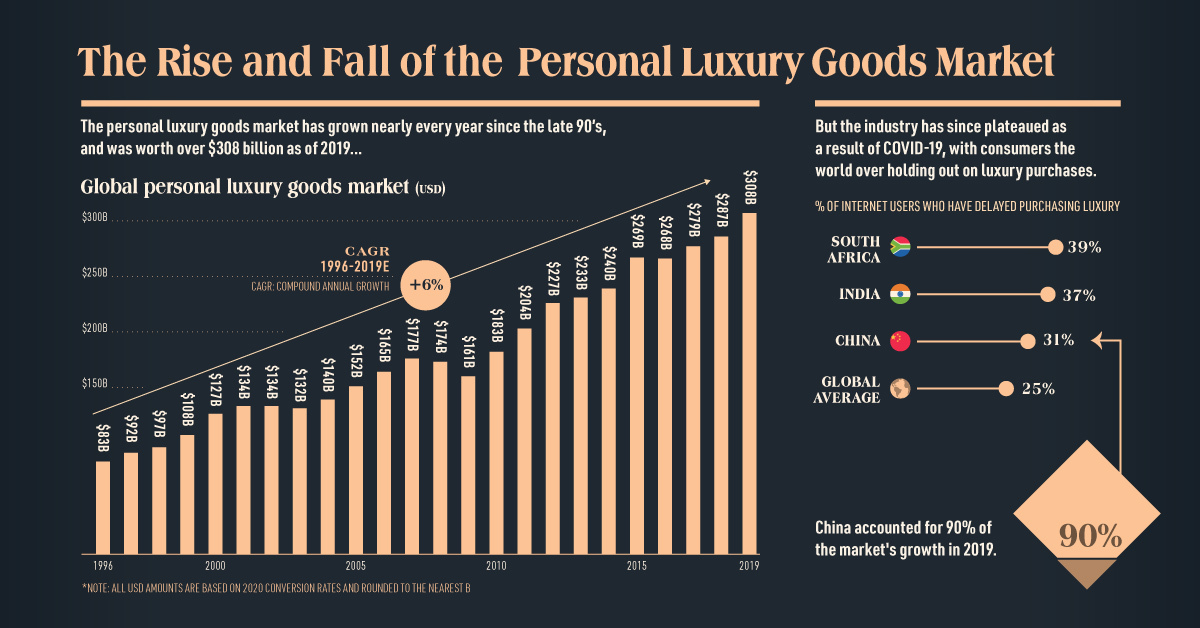
Global demand for personal luxury goods has been steadily increasing for decades, resulting in an industry worth $308 billion in 2019.
However, the insatiable desire for consumers to own nice things was suddenly interrupted by the coming of COVID-19, and experts are predicting a brutal contraction of up to one-third of the current luxury good market size this year.
Will the industry bounce back? Or will it return as something noticeably different?
A Once Promising Trajectory
The global luxury goods market—which includes beauty, apparel, and accessories—has compounded at a 6% pace since the 1990s.
Recent years of growth in the personal luxury goods market can be mostly attributed to Chinese consumers. This geographic market accounted for 90% of total sales growth in 2019, followed by the Europe and the Americas.
Analysts suggest that China’s younger luxury goods consumers in particular have significant spending power, with an average spend of $6,000 (¥41,000) per person in pre-COVID times.
An Industry Now in Distress
The lethal combination of reduced foot traffic and decreased consumer spending in the first quarter of 2020 has brought the retail industry to its knees.
In fact, more than 80% of fashion and luxury players will experience financial distress as a result of extended store closures.
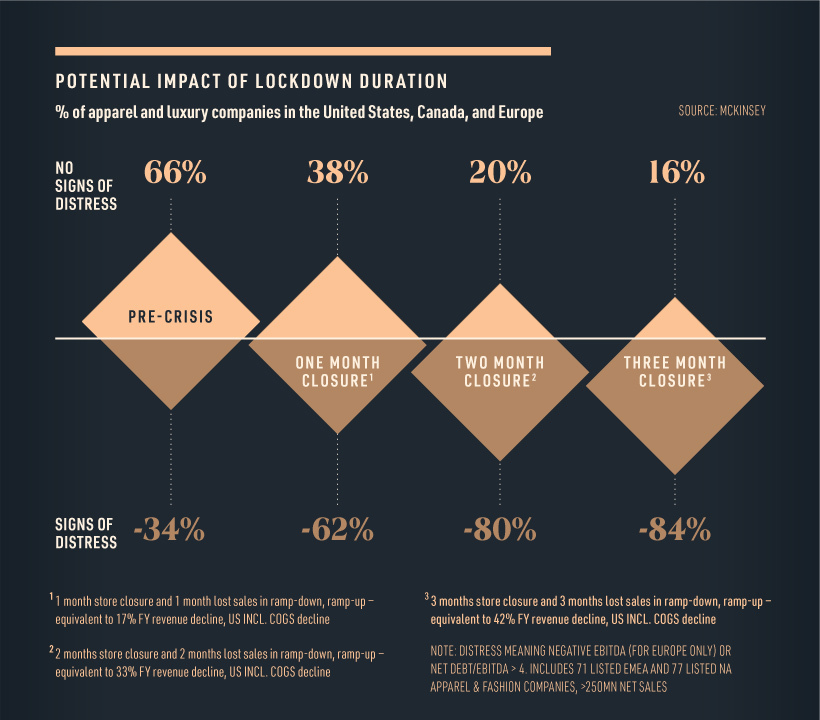
With iconic luxury retailers such as Neiman Marcus filing for bankruptcy, the pressure on the luxury industry is clear. It should be noted however, that companies who were experiencing distress before the COVID-19 outbreak will be the hardest hit.
Predicting the Collapse
In a recent report, Bain & Company estimated a 25% to 30% global luxury market contraction for the first quarter of 2020 based on several economic variables. They have also modeled three scenarios to predict the performance for the remainder of 2020.
- Optimistic scenario: A limited market contraction of 15% to 18%, assuming increased consumer demand for the second and third quarter of the year, roughly equating to a sales decline of $46 billion to $56 billion.
- Intermediate scenario: A moderate market contraction of between 22% and 25%, or $68 to $77 billion.
- Worst-case scenario: A steep contraction of between 30% and 35%, equating to $92 billion to $108 billion. This assumes a longer period of sales decline.
Although there are signs of recovery in China, the industry is not expected to fully return to 2019 levels until 2022 at the earliest. By that stage, the industry could have transformed entirely.
Changing Consumer Mindsets
Since the beginning of the pandemic, one-quarter of consumers have delayed purchasing luxury items. In fact, a portion of those who have delayed purchasing luxury goods are now considering entirely new avenues, such as seeking out cheaper alternatives.
However, most people surveyed claim that they will postpone buying luxury items until they can get a better deal on price.
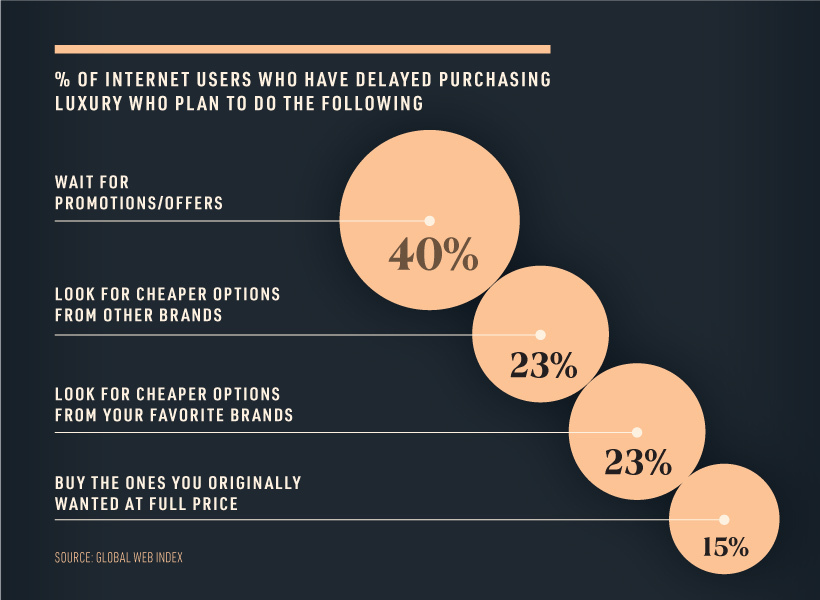
This frugal mindset could spark an interesting behavioral shift, and set the stage for a new category to emerge from the ashes—the second-hand luxury market.
Numerous sources claim that pre-owned luxury could in fact overtake the traditional luxury market, and the pandemic economy could very well be a tipping point.
The Future of Luxury
Medium-term market growth could be driven by a number of factors, from a global growing middle class and their demand for luxury products, as well as retailers’ sudden shift to e-commerce.
While analysts can only rely on predictions to determine the future of personal luxury, it is clear that the industry is at a crossroads.


Markets
U.S. Debt Interest Payments Reach $1 Trillion
U.S. debt interest payments have surged past the $1 trillion dollar mark, amid high interest rates and an ever-expanding debt burden.


U.S. Debt Interest Payments Reach $1 Trillion
This was originally posted on our Voronoi app. Download the app for free on iOS or Android and discover incredible data-driven charts from a variety of trusted sources.
The cost of paying for America’s national debt crossed the $1 trillion dollar mark in 2023, driven by high interest rates and a record $34 trillion mountain of debt.
Over the last decade, U.S. debt interest payments have more than doubled amid vast government spending during the pandemic crisis. As debt payments continue to soar, the Congressional Budget Office (CBO) reported that debt servicing costs surpassed defense spending for the first time ever this year.
This graphic shows the sharp rise in U.S. debt payments, based on data from the Federal Reserve.
A $1 Trillion Interest Bill, and Growing
Below, we show how U.S. debt interest payments have risen at a faster pace than at another time in modern history:
| Date | Interest Payments | U.S. National Debt |
|---|---|---|
| 2023 | $1.0T | $34.0T |
| 2022 | $830B | $31.4T |
| 2021 | $612B | $29.6T |
| 2020 | $518B | $27.7T |
| 2019 | $564B | $23.2T |
| 2018 | $571B | $22.0T |
| 2017 | $493B | $20.5T |
| 2016 | $460B | $20.0T |
| 2015 | $435B | $18.9T |
| 2014 | $442B | $18.1T |
| 2013 | $425B | $17.2T |
| 2012 | $417B | $16.4T |
| 2011 | $433B | $15.2T |
| 2010 | $400B | $14.0T |
| 2009 | $354B | $12.3T |
| 2008 | $380B | $10.7T |
| 2007 | $414B | $9.2T |
| 2006 | $387B | $8.7T |
| 2005 | $355B | $8.2T |
| 2004 | $318B | $7.6T |
| 2003 | $294B | $7.0T |
| 2002 | $298B | $6.4T |
| 2001 | $318B | $5.9T |
| 2000 | $353B | $5.7T |
| 1999 | $353B | $5.8T |
| 1998 | $360B | $5.6T |
| 1997 | $368B | $5.5T |
| 1996 | $362B | $5.3T |
| 1995 | $357B | $5.0T |
| 1994 | $334B | $4.8T |
| 1993 | $311B | $4.5T |
| 1992 | $306B | $4.2T |
| 1991 | $308B | $3.8T |
| 1990 | $298B | $3.4T |
| 1989 | $275B | $3.0T |
| 1988 | $254B | $2.7T |
| 1987 | $240B | $2.4T |
| 1986 | $225B | $2.2T |
| 1985 | $219B | $1.9T |
| 1984 | $205B | $1.7T |
| 1983 | $176B | $1.4T |
| 1982 | $157B | $1.2T |
| 1981 | $142B | $1.0T |
| 1980 | $113B | $930.2B |
| 1979 | $96B | $845.1B |
| 1978 | $84B | $789.2B |
| 1977 | $69B | $718.9B |
| 1976 | $61B | $653.5B |
| 1975 | $55B | $576.6B |
| 1974 | $50B | $492.7B |
| 1973 | $45B | $469.1B |
| 1972 | $39B | $448.5B |
| 1971 | $36B | $424.1B |
| 1970 | $35B | $389.2B |
| 1969 | $30B | $368.2B |
| 1968 | $25B | $358.0B |
| 1967 | $23B | $344.7B |
| 1966 | $21B | $329.3B |
Interest payments represent seasonally adjusted annual rate at the end of Q4.
At current rates, the U.S. national debt is growing by a remarkable $1 trillion about every 100 days, equal to roughly $3.6 trillion per year.
As the national debt has ballooned, debt payments even exceeded Medicaid outlays in 2023—one of the government’s largest expenditures. On average, the U.S. spent more than $2 billion per day on interest costs last year. Going further, the U.S. government is projected to spend a historic $12.4 trillion on interest payments over the next decade, averaging about $37,100 per American.
Exacerbating matters is that the U.S. is running a steep deficit, which stood at $1.1 trillion for the first six months of fiscal 2024. This has accelerated due to the 43% increase in debt servicing costs along with a $31 billion dollar increase in defense spending from a year earlier. Additionally, a $30 billion increase in funding for the Federal Deposit Insurance Corporation in light of the regional banking crisis last year was a major contributor to the deficit increase.
Overall, the CBO forecasts that roughly 75% of the federal deficit’s increase will be due to interest costs by 2034.

-

 Travel1 week ago
Airline Incidents: How Do Boeing and Airbus Compare?
-

 Markets2 weeks ago
Visualizing America’s Shortage of Affordable Homes
-

 Green2 weeks ago
Ranked: Top Countries by Total Forest Loss Since 2001
-

 Money2 weeks ago
Where Does One U.S. Tax Dollar Go?
-

 Misc2 weeks ago
Almost Every EV Stock is Down After Q1 2024
-

 AI2 weeks ago
The Stock Performance of U.S. Chipmakers So Far in 2024
-

 Markets2 weeks ago
Charted: Big Four Market Share by S&P 500 Audits
-

 Real Estate2 weeks ago
Ranked: The Most Valuable Housing Markets in America