Technology
Charting the Automation Potential of U.S. Jobs
https://public.tableau.com/javascripts/api/viz_v1.js
Charting the Automation Potential of U.S. Jobs
In last week’s Chart of the Week, we noted that 1.3 million industrial robots would be installed between 2015 and 2018, and this would more than double the stock of active robots around the world.
While many of those robots will be used in the automotive and electronics sectors, there are many other roles that robots will be filling in the future. Surprisingly, according to global consultant McKinsey & Co, not all of these jobs are low-skill, low-wage jobs, either.
Mckinsey ran a comprehensive study of nearly 800 different jobs in the United States, ranging from CEOs to fast food workers. Between these roles, they found 2,000 individual work activities, and assessed them against 18 different capabilities that could potentially be automated. In their analysis, they found that 45% of work activities representing $2 trillion in wages can already by automated based on proven technology that currently exists. A further 13% of work activities in the U.S. economy could be automated if the technologies used to understand and process human language were brought up to the median human level of competence.
Who’s in, Who’s Out?
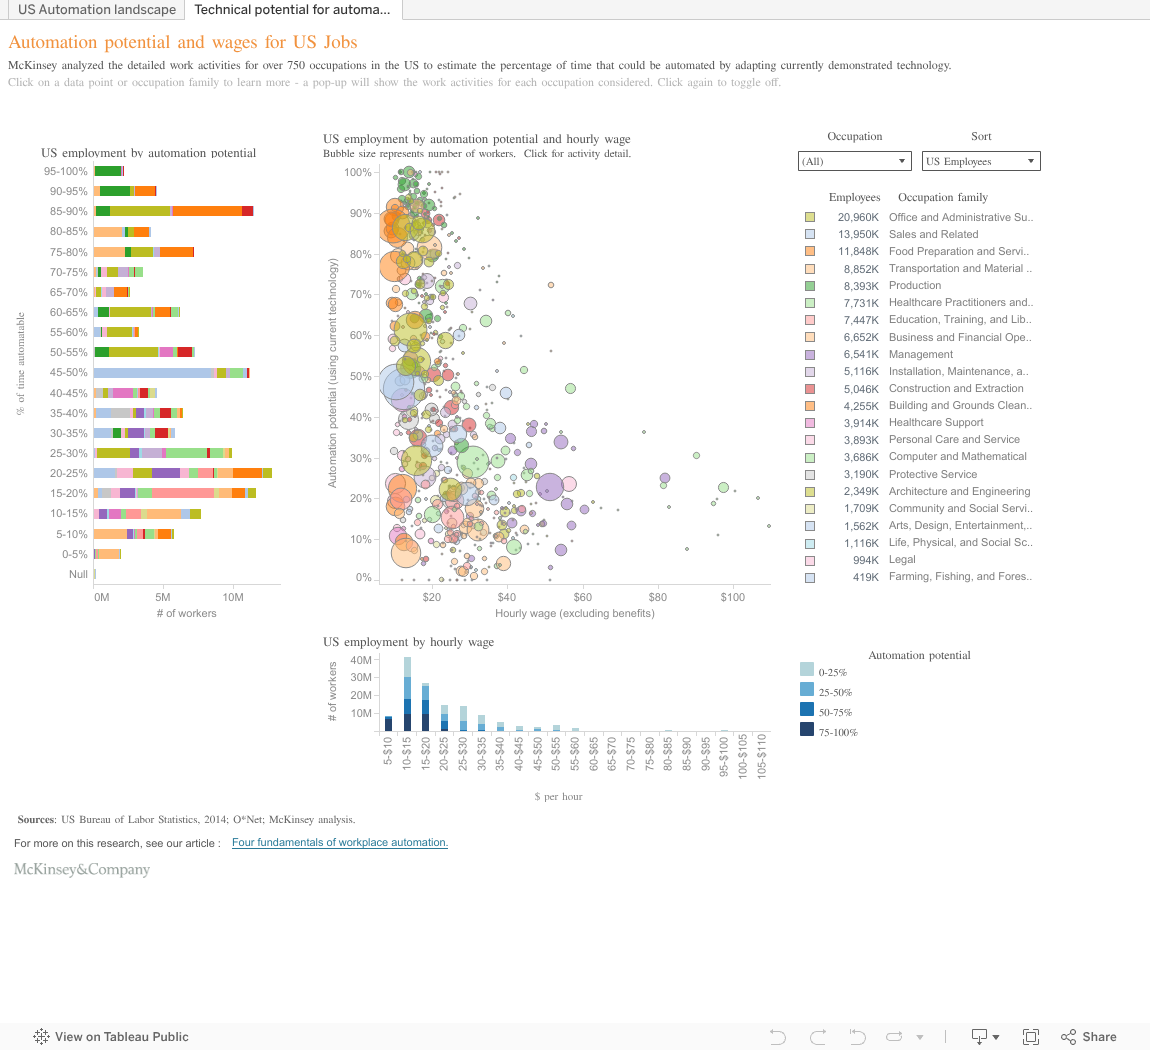
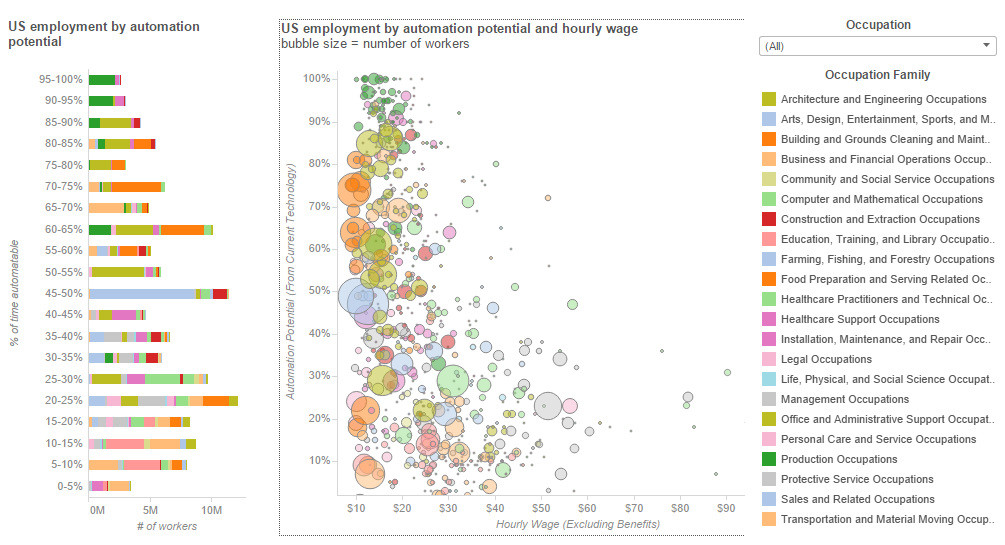
The interactive visualization above charts specific careers on their automation potential (out of 100%) along with the hourly average wage of the job.
What is most interesting about the analysis is that automation potential doesn’t correlate with low-skill, low-wage jobs as much as one may think. While it’s true that the three million fast food workers across the country have an automation potential of 74%, and that heavy truck driving activities can be 69% automated, there are also great counter-examples: for example, only 7% of manual labor and 22% of janitorial activities could be automated.
Likewise, high-paying jobs are not necessarily robot-proof.
Doctors (23%), nurses (29%), and even CEOs (25%) all have significant amounts of their jobs that can be automated with current technology. Almost half (47%) of what pharmacists do can be done by a robo-pharmacist, and 72% of commercial pilot activities can be done through computers.
Not interested in having a robot fill your shoes? Mckinsey notes at the end of their analysis that both creativity and sensing emotion are extremely difficult to automate. Focus on building skills and competencies in these categories, and you’ll be just fine (for now, at least).


Technology
Visualizing AI Patents by Country
See which countries have been granted the most AI patents each year, from 2012 to 2022.


Visualizing AI Patents by Country
This was originally posted on our Voronoi app. Download the app for free on iOS or Android and discover incredible data-driven charts from a variety of trusted sources.
This infographic shows the number of AI-related patents granted each year from 2010 to 2022 (latest data available). These figures come from the Center for Security and Emerging Technology (CSET), accessed via Stanford University’s 2024 AI Index Report.
From this data, we can see that China first overtook the U.S. in 2013. Since then, the country has seen enormous growth in the number of AI patents granted each year.
| Year | China | EU and UK | U.S. | RoW | Global Total |
|---|---|---|---|---|---|
| 2010 | 307 | 137 | 984 | 571 | 1,999 |
| 2011 | 516 | 129 | 980 | 581 | 2,206 |
| 2012 | 926 | 112 | 950 | 660 | 2,648 |
| 2013 | 1,035 | 91 | 970 | 627 | 2,723 |
| 2014 | 1,278 | 97 | 1,078 | 667 | 3,120 |
| 2015 | 1,721 | 110 | 1,135 | 539 | 3,505 |
| 2016 | 1,621 | 128 | 1,298 | 714 | 3,761 |
| 2017 | 2,428 | 144 | 1,489 | 1,075 | 5,136 |
| 2018 | 4,741 | 155 | 1,674 | 1,574 | 8,144 |
| 2019 | 9,530 | 322 | 3,211 | 2,720 | 15,783 |
| 2020 | 13,071 | 406 | 5,441 | 4,455 | 23,373 |
| 2021 | 21,907 | 623 | 8,219 | 7,519 | 38,268 |
| 2022 | 35,315 | 1,173 | 12,077 | 13,699 | 62,264 |
In 2022, China was granted more patents than every other country combined.
While this suggests that the country is very active in researching the field of artificial intelligence, it doesn’t necessarily mean that China is the farthest in terms of capability.
Key Facts About AI Patents
According to CSET, AI patents relate to mathematical relationships and algorithms, which are considered abstract ideas under patent law. They can also have different meaning, depending on where they are filed.
In the U.S., AI patenting is concentrated amongst large companies including IBM, Microsoft, and Google. On the other hand, AI patenting in China is more distributed across government organizations, universities, and tech firms (e.g. Tencent).
In terms of focus area, China’s patents are typically related to computer vision, a field of AI that enables computers and systems to interpret visual data and inputs. Meanwhile America’s efforts are more evenly distributed across research fields.
Learn More About AI From Visual Capitalist
If you want to see more data visualizations on artificial intelligence, check out this graphic that shows which job departments will be impacted by AI the most.

-

 Markets1 week ago
U.S. Debt Interest Payments Reach $1 Trillion
-

 Markets2 weeks ago
Ranked: The Most Valuable Housing Markets in America
-

 Money2 weeks ago
Which States Have the Highest Minimum Wage in America?
-

 AI2 weeks ago
Ranked: Semiconductor Companies by Industry Revenue Share
-

 Markets2 weeks ago
Ranked: The World’s Top Flight Routes, by Revenue
-

 Countries2 weeks ago
Population Projections: The World’s 6 Largest Countries in 2075
-

 Markets2 weeks ago
The Top 10 States by Real GDP Growth in 2023
-

 Money2 weeks ago
The Smallest Gender Wage Gaps in OECD Countries