Technology
Chart: Ranking the World’s Most Valuable Brands
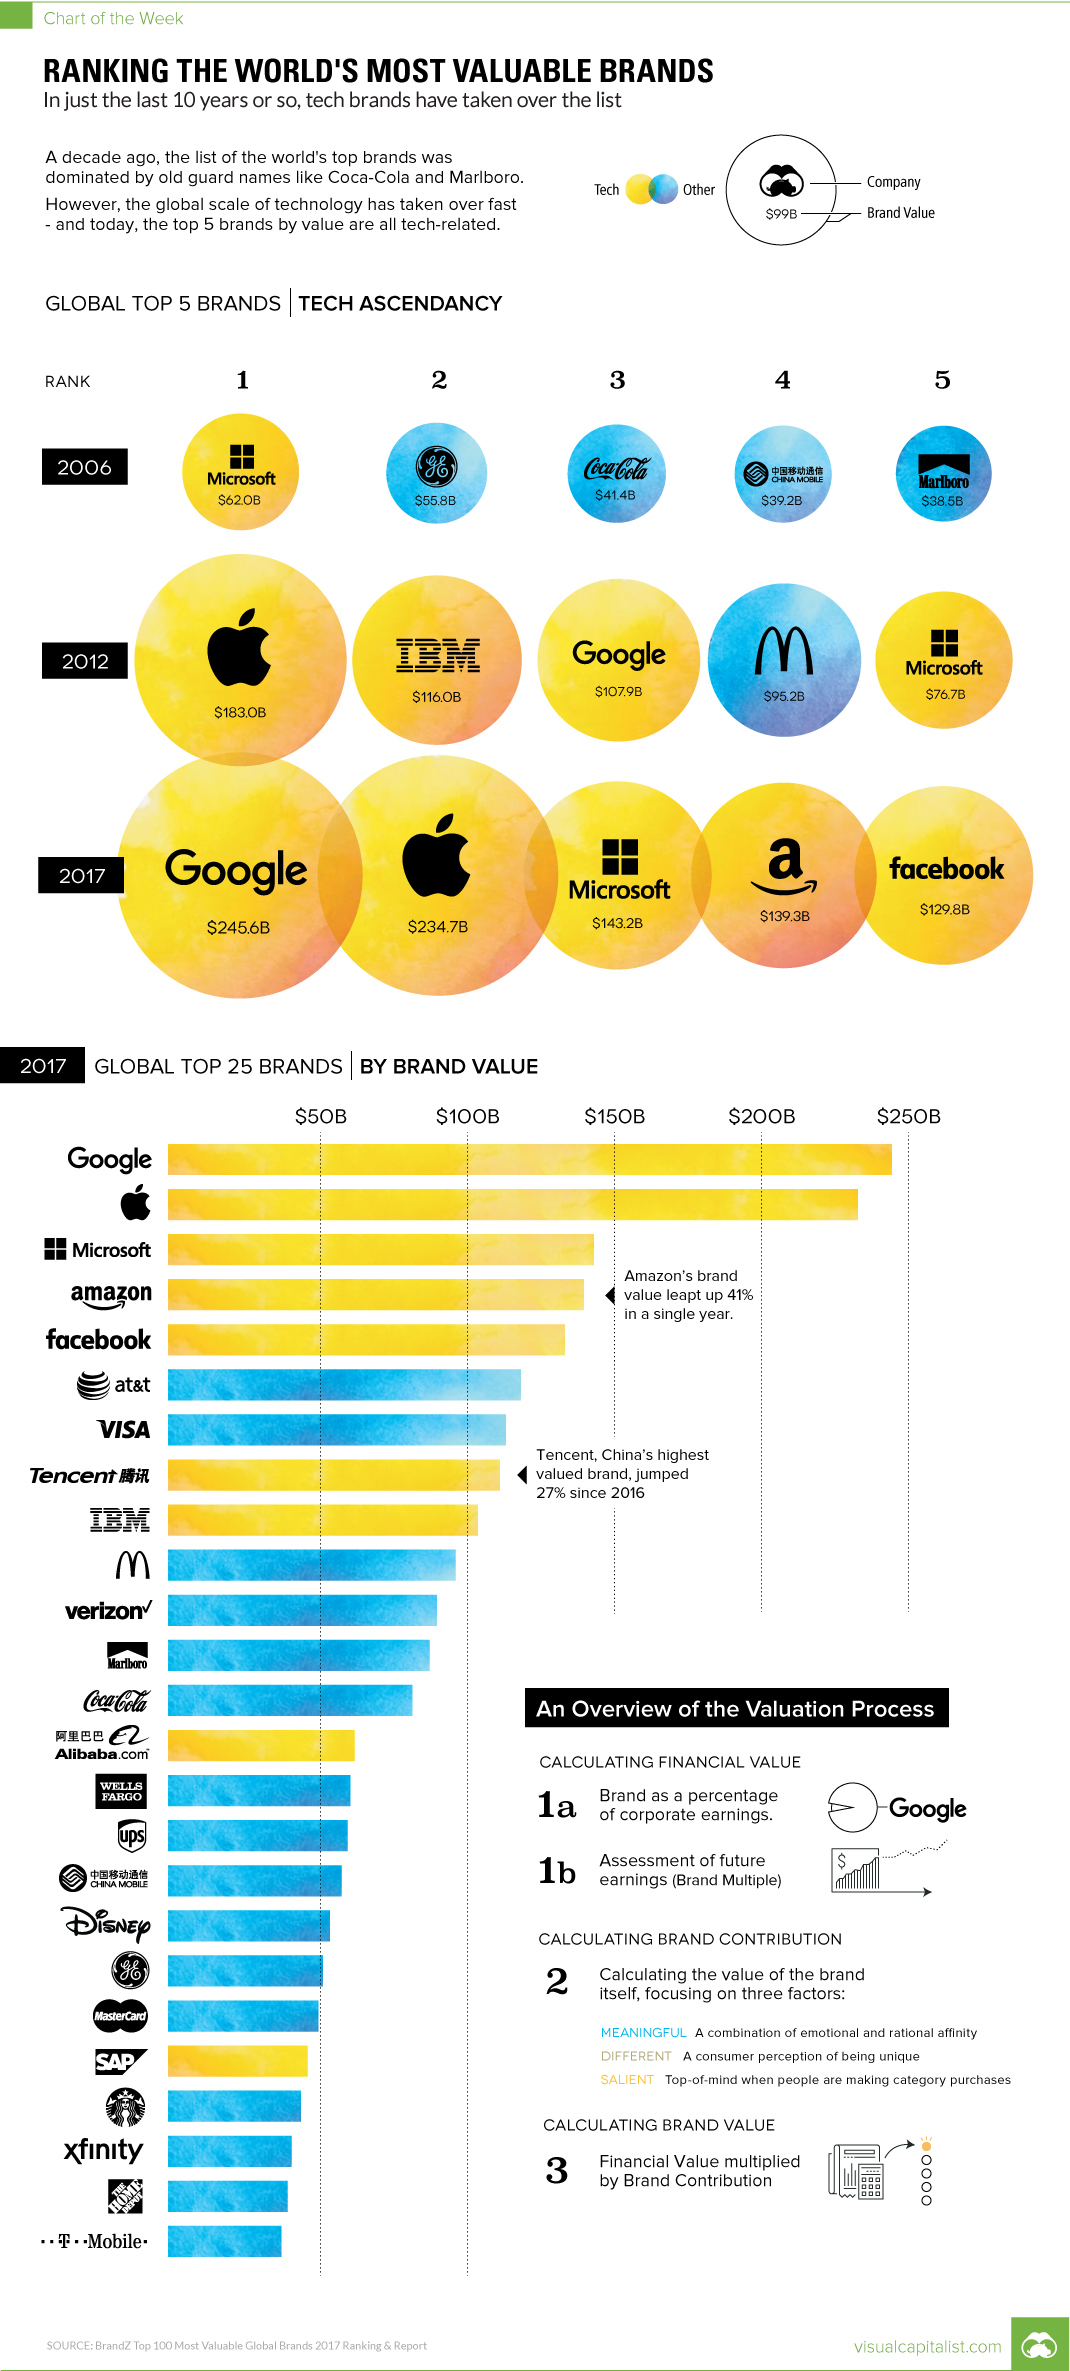
Chart: Ranking the World’s Most Valuable Brands
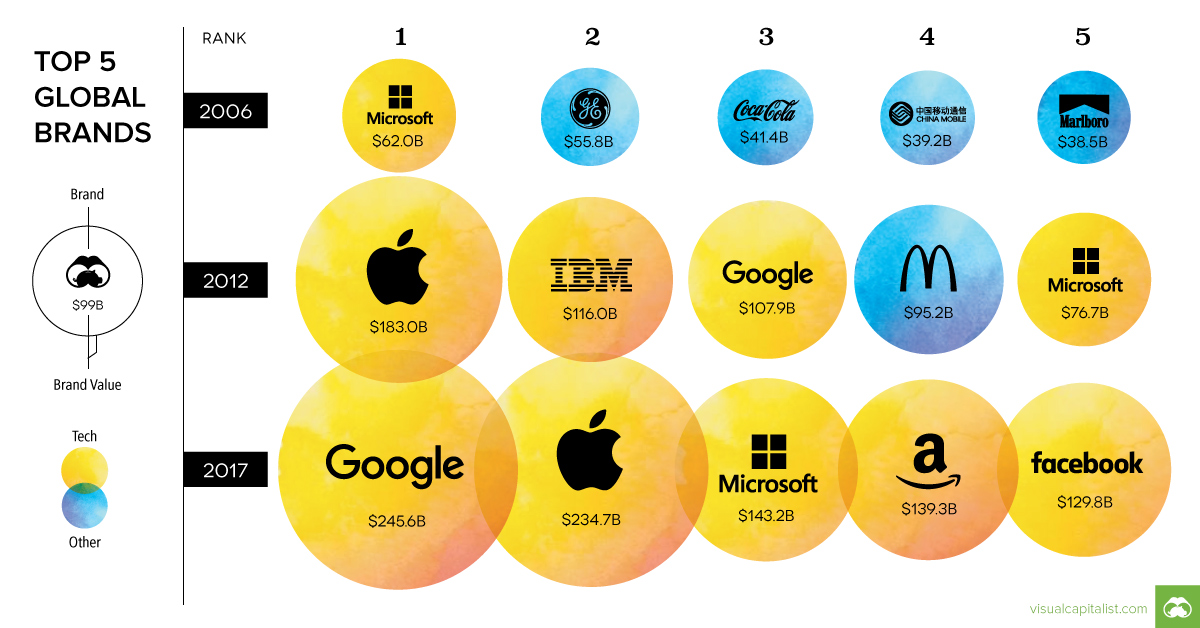
In just 10 years, tech brands have taken over the list
The Chart of the Week is a weekly Visual Capitalist feature on Fridays.
Tech has already conquered the stock market and the realm of digital advertising.
Now the technology sector also has a strangle hold on another measure: the value of consumer brands.
| Global Rank | Brand | Brand Value 2017 |
|---|---|---|
| #1 | $245.6 billion | |
| #2 | Apple | $234.7 billion |
| #3 | Microsoft | $143.2 billion |
| #4 | Amazon | $139.3 billion |
| #5 | $129.8 billion |
The massive scale and reach of tech companies has helped their brand values to skyrocket over the last decade. In fact, even just adding Google and Apple’s most recent numbers together gives a figure that rivals the GDP of Sweden.
What is Brand Value, Anyways?
This data on the most valuable brands comes from the BrandZ Top 100 Global Brands report for 2017, which uses a specific methodology to quantify the financial worth of different brands around the world.
In this case, by “brand”, we are referring to the intangible asset that exists in the minds of consumers, which is usually an image forged over time through exposure to branding, ads, publicity, and other types of personal experiences.
Meanwhile, the “brand value” is the dollar amount a brand contributes to the overall value of a corporation. Measuring this intangible asset reveals an additional source of shareholder value that otherwise would not exist.
Diving Deeper
What types of companies are building the strongest brands?
Here is the Top 100 list broken down by a few different key categories.
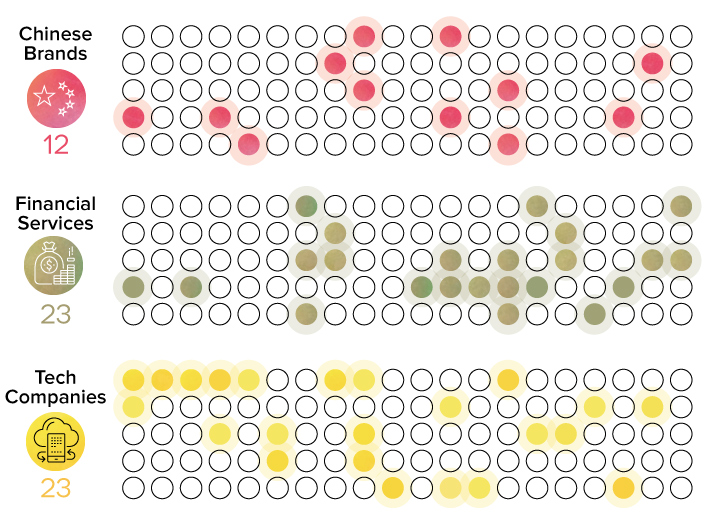
Note: in these rankings we are counting both Amazon and Alibaba as tech companies
The amount of Chinese brands making the Top 100 is rising quickly – in 2008, only four made the list.
Today, there are 12 Chinese brands on the list, including widely-known names such as Huawei, Alibaba, and Ping An Insurance.
Other types of brands that do well in the rankings include financial services (23 of 100 brands) and technology (23 of 100 brands).
Brand Value on the Rise
Overall, the cumulative brand value of all 100 companies on the list has been rising. It now sits at $3.6 trillion in total.
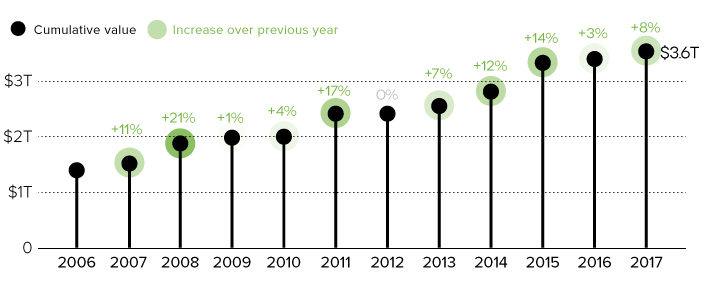
For comparison’s sake – that’s bigger than the annual GDP of Germany, the world’s fourth largest economy.


Technology
Visualizing AI Patents by Country
See which countries have been granted the most AI patents each year, from 2012 to 2022.


Visualizing AI Patents by Country
This was originally posted on our Voronoi app. Download the app for free on iOS or Android and discover incredible data-driven charts from a variety of trusted sources.
This infographic shows the number of AI-related patents granted each year from 2010 to 2022 (latest data available). These figures come from the Center for Security and Emerging Technology (CSET), accessed via Stanford University’s 2024 AI Index Report.
From this data, we can see that China first overtook the U.S. in 2013. Since then, the country has seen enormous growth in the number of AI patents granted each year.
| Year | China | EU and UK | U.S. | RoW | Global Total |
|---|---|---|---|---|---|
| 2010 | 307 | 137 | 984 | 571 | 1,999 |
| 2011 | 516 | 129 | 980 | 581 | 2,206 |
| 2012 | 926 | 112 | 950 | 660 | 2,648 |
| 2013 | 1,035 | 91 | 970 | 627 | 2,723 |
| 2014 | 1,278 | 97 | 1,078 | 667 | 3,120 |
| 2015 | 1,721 | 110 | 1,135 | 539 | 3,505 |
| 2016 | 1,621 | 128 | 1,298 | 714 | 3,761 |
| 2017 | 2,428 | 144 | 1,489 | 1,075 | 5,136 |
| 2018 | 4,741 | 155 | 1,674 | 1,574 | 8,144 |
| 2019 | 9,530 | 322 | 3,211 | 2,720 | 15,783 |
| 2020 | 13,071 | 406 | 5,441 | 4,455 | 23,373 |
| 2021 | 21,907 | 623 | 8,219 | 7,519 | 38,268 |
| 2022 | 35,315 | 1,173 | 12,077 | 13,699 | 62,264 |
In 2022, China was granted more patents than every other country combined.
While this suggests that the country is very active in researching the field of artificial intelligence, it doesn’t necessarily mean that China is the farthest in terms of capability.
Key Facts About AI Patents
According to CSET, AI patents relate to mathematical relationships and algorithms, which are considered abstract ideas under patent law. They can also have different meaning, depending on where they are filed.
In the U.S., AI patenting is concentrated amongst large companies including IBM, Microsoft, and Google. On the other hand, AI patenting in China is more distributed across government organizations, universities, and tech firms (e.g. Tencent).
In terms of focus area, China’s patents are typically related to computer vision, a field of AI that enables computers and systems to interpret visual data and inputs. Meanwhile America’s efforts are more evenly distributed across research fields.
Learn More About AI From Visual Capitalist
If you want to see more data visualizations on artificial intelligence, check out this graphic that shows which job departments will be impacted by AI the most.

-

 Markets1 week ago
U.S. Debt Interest Payments Reach $1 Trillion
-

 Business2 weeks ago
Charted: Big Four Market Share by S&P 500 Audits
-

 Real Estate2 weeks ago
Ranked: The Most Valuable Housing Markets in America
-

 Money2 weeks ago
Which States Have the Highest Minimum Wage in America?
-

 AI2 weeks ago
Ranked: Semiconductor Companies by Industry Revenue Share
-

 Markets2 weeks ago
Ranked: The World’s Top Flight Routes, by Revenue
-

 Demographics2 weeks ago
Population Projections: The World’s 6 Largest Countries in 2075
-

 Markets2 weeks ago
The Top 10 States by Real GDP Growth in 2023