Technology
Chart: Ranking the World’s Most Valuable Brands
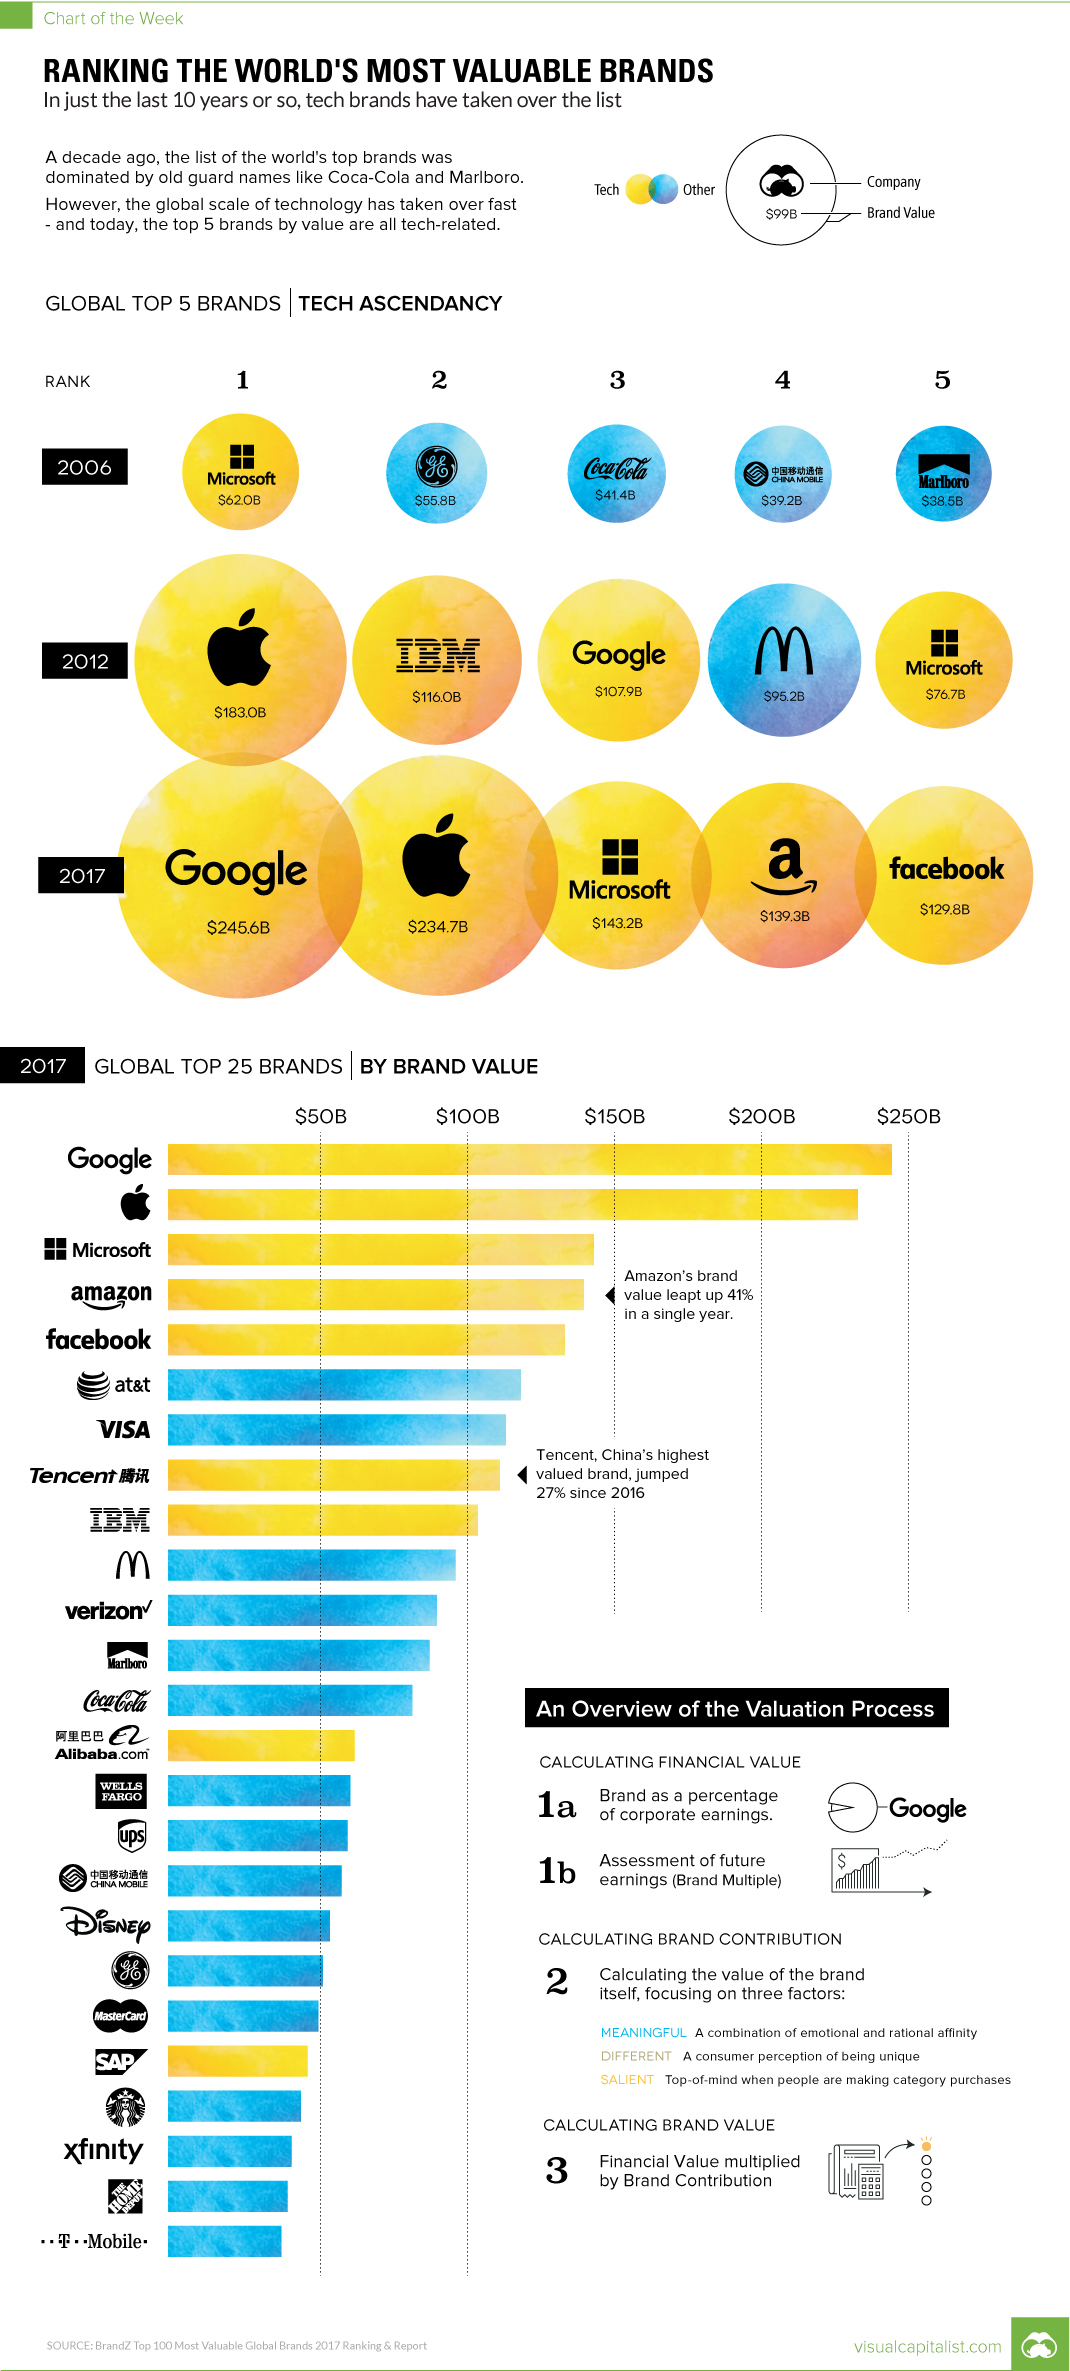
Chart: Ranking the World’s Most Valuable Brands
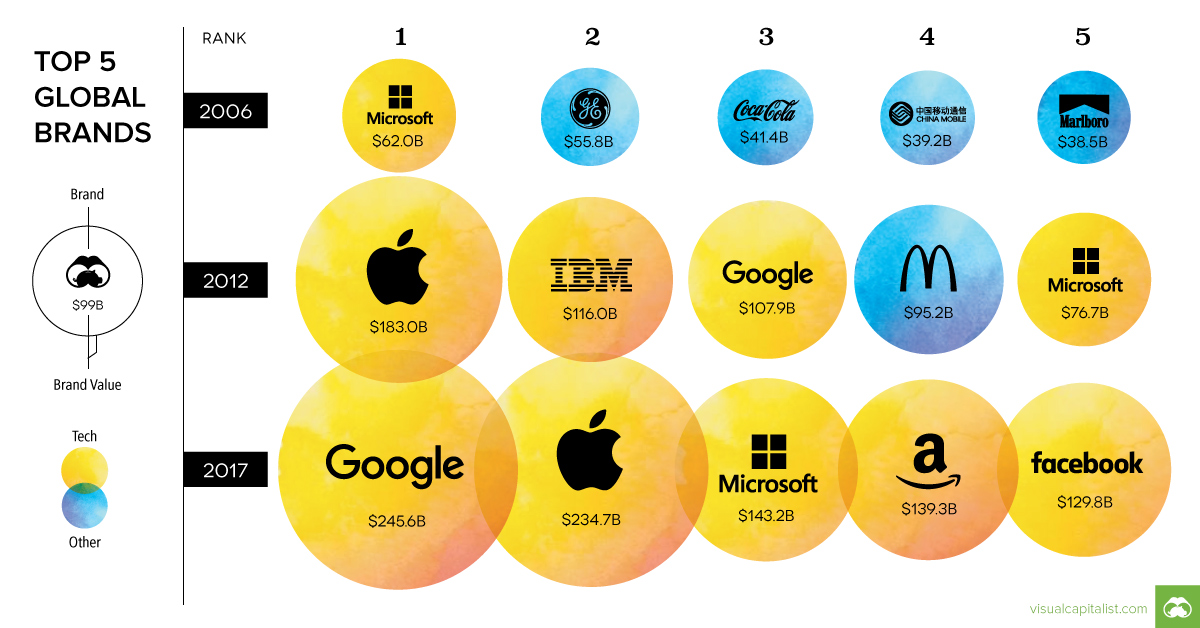
In just 10 years, tech brands have taken over the list
The Chart of the Week is a weekly Visual Capitalist feature on Fridays.
Tech has already conquered the stock market and the realm of digital advertising.
Now the technology sector also has a strangle hold on another measure: the value of consumer brands.
| Global Rank | Brand | Brand Value 2017 |
|---|---|---|
| #1 | $245.6 billion | |
| #2 | Apple | $234.7 billion |
| #3 | Microsoft | $143.2 billion |
| #4 | Amazon | $139.3 billion |
| #5 | $129.8 billion |
The massive scale and reach of tech companies has helped their brand values to skyrocket over the last decade. In fact, even just adding Google and Apple’s most recent numbers together gives a figure that rivals the GDP of Sweden.
What is Brand Value, Anyways?
This data on the most valuable brands comes from the BrandZ Top 100 Global Brands report for 2017, which uses a specific methodology to quantify the financial worth of different brands around the world.
In this case, by “brand”, we are referring to the intangible asset that exists in the minds of consumers, which is usually an image forged over time through exposure to branding, ads, publicity, and other types of personal experiences.
Meanwhile, the “brand value” is the dollar amount a brand contributes to the overall value of a corporation. Measuring this intangible asset reveals an additional source of shareholder value that otherwise would not exist.
Diving Deeper
What types of companies are building the strongest brands?
Here is the Top 100 list broken down by a few different key categories.
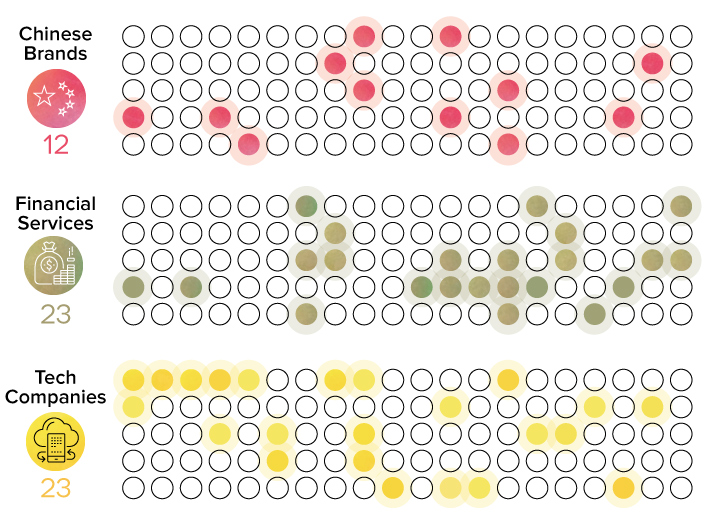
Note: in these rankings we are counting both Amazon and Alibaba as tech companies
The amount of Chinese brands making the Top 100 is rising quickly – in 2008, only four made the list.
Today, there are 12 Chinese brands on the list, including widely-known names such as Huawei, Alibaba, and Ping An Insurance.
Other types of brands that do well in the rankings include financial services (23 of 100 brands) and technology (23 of 100 brands).
Brand Value on the Rise
Overall, the cumulative brand value of all 100 companies on the list has been rising. It now sits at $3.6 trillion in total.
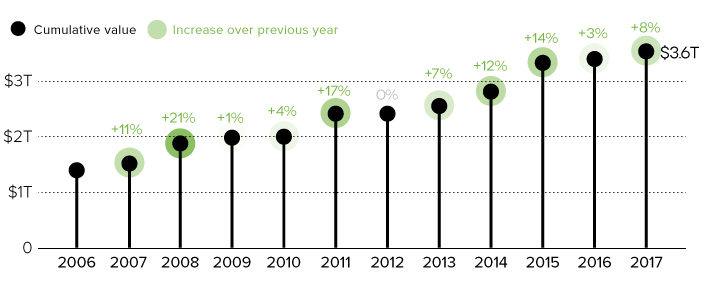
For comparison’s sake – that’s bigger than the annual GDP of Germany, the world’s fourth largest economy.


Technology
Ranked: Semiconductor Companies by Industry Revenue Share
Nvidia is coming for Intel’s crown. Samsung is losing ground. AI is transforming the space. We break down revenue for semiconductor companies.


Semiconductor Companies by Industry Revenue Share
This was originally posted on our Voronoi app. Download the app for free on Apple or Android and discover incredible data-driven charts from a variety of trusted sources.
Did you know that some computer chips are now retailing for the price of a new BMW?
As computers invade nearly every sphere of life, so too have the chips that power them, raising the revenues of the businesses dedicated to designing them.
But how did various chipmakers measure against each other last year?
We rank the biggest semiconductor companies by their percentage share of the industry’s revenues in 2023, using data from Omdia research.
Which Chip Company Made the Most Money in 2023?
Market leader and industry-defining veteran Intel still holds the crown for the most revenue in the sector, crossing $50 billion in 2023, or 10% of the broader industry’s topline.
All is not well at Intel, however, with the company’s stock price down over 20% year-to-date after it revealed billion-dollar losses in its foundry business.
| Rank | Company | 2023 Revenue | % of Industry Revenue |
|---|---|---|---|
| 1 | Intel | $51B | 9.4% |
| 2 | NVIDIA | $49B | 9.0% |
| 3 | Samsung Electronics | $44B | 8.1% |
| 4 | Qualcomm | $31B | 5.7% |
| 5 | Broadcom | $28B | 5.2% |
| 6 | SK Hynix | $24B | 4.4% |
| 7 | AMD | $22B | 4.1% |
| 8 | Apple | $19B | 3.4% |
| 9 | Infineon Tech | $17B | 3.2% |
| 10 | STMicroelectronics | $17B | 3.2% |
| 11 | Texas Instruments | $17B | 3.1% |
| 12 | Micron Technology | $16B | 2.9% |
| 13 | MediaTek | $14B | 2.6% |
| 14 | NXP | $13B | 2.4% |
| 15 | Analog Devices | $12B | 2.2% |
| 16 | Renesas Electronics Corporation | $11B | 1.9% |
| 17 | Sony Semiconductor Solutions Corporation | $10B | 1.9% |
| 18 | Microchip Technology | $8B | 1.5% |
| 19 | Onsemi | $8B | 1.4% |
| 20 | KIOXIA Corporation | $7B | 1.3% |
| N/A | Others | $126B | 23.2% |
| N/A | Total | $545B | 100% |
Note: Figures are rounded. Totals and percentages may not sum to 100.
Meanwhile, Nvidia is very close to overtaking Intel, after declaring $49 billion of topline revenue for 2023. This is more than double its 2022 revenue ($21 billion), increasing its share of industry revenues to 9%.
Nvidia’s meteoric rise has gotten a huge thumbs-up from investors. It became a trillion dollar stock last year, and broke the single-day gain record for market capitalization this year.
Other chipmakers haven’t been as successful. Out of the top 20 semiconductor companies by revenue, 12 did not match their 2022 revenues, including big names like Intel, Samsung, and AMD.
The Many Different Types of Chipmakers
All of these companies may belong to the same industry, but they don’t focus on the same niche.
According to Investopedia, there are four major types of chips, depending on their functionality: microprocessors, memory chips, standard chips, and complex systems on a chip.
Nvidia’s core business was once GPUs for computers (graphics processing units), but in recent years this has drastically shifted towards microprocessors for analytics and AI.
These specialized chips seem to be where the majority of growth is occurring within the sector. For example, companies that are largely in the memory segment—Samsung, SK Hynix, and Micron Technology—saw peak revenues in the mid-2010s.

-

 Real Estate2 weeks ago
Visualizing America’s Shortage of Affordable Homes
-

 Technology1 week ago
Ranked: Semiconductor Companies by Industry Revenue Share
-

 Money1 week ago
Which States Have the Highest Minimum Wage in America?
-

 Real Estate1 week ago
Ranked: The Most Valuable Housing Markets in America
-

 Business2 weeks ago
Charted: Big Four Market Share by S&P 500 Audits
-

 AI2 weeks ago
The Stock Performance of U.S. Chipmakers So Far in 2024
-

 Misc2 weeks ago
Almost Every EV Stock is Down After Q1 2024
-

 Money2 weeks ago
Where Does One U.S. Tax Dollar Go?