Markets
Ranked: The 10 Wealthiest Countries in the World
The 10 Wealthiest Countries
The Chart of the Week is a weekly Visual Capitalist feature on Fridays.
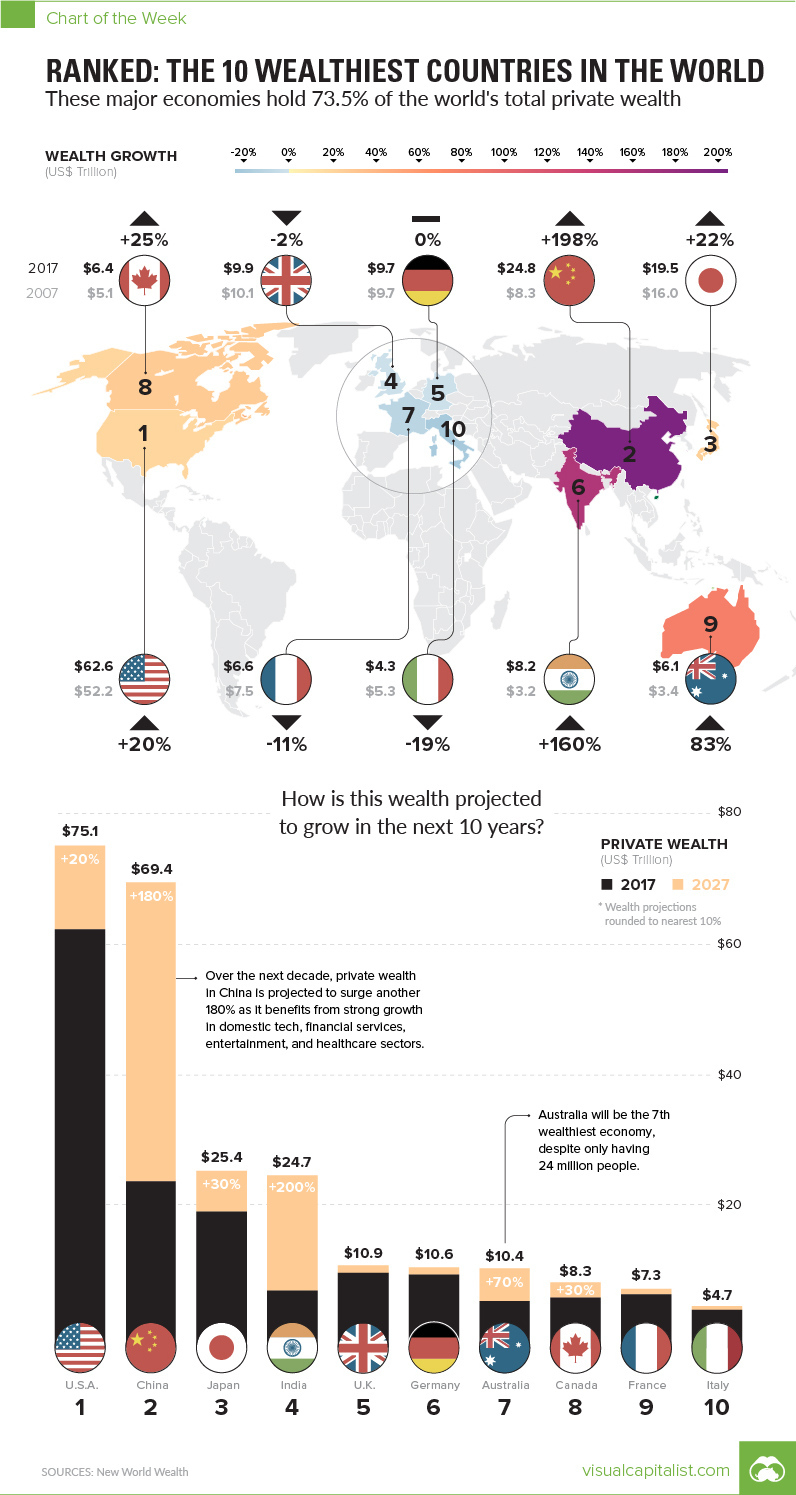
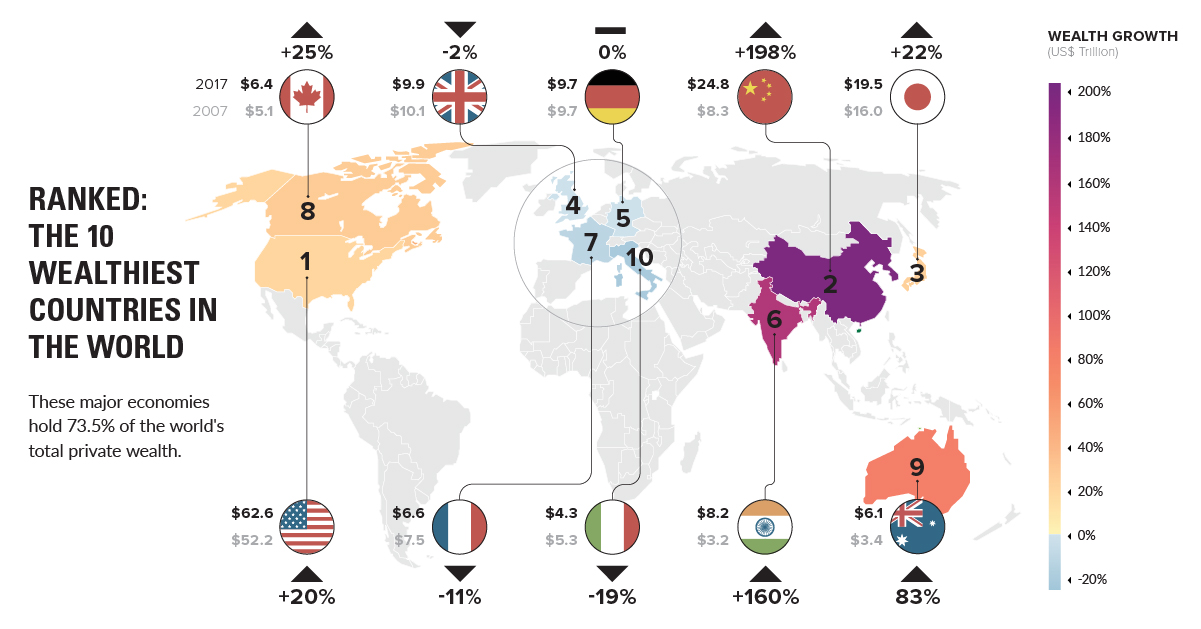
According to market research company New World Wealth, the world has accumulated $215 trillion in private wealth, a 12% increase over the last year.
Incredibly, the vast majority of this wealth – about 73.5% – is held by just 10 countries:
| Rank | Country | Wealth ($ Trillions) | Change (2007-2017, %) |
|---|---|---|---|
| #1 | United States | $62.6 | 20% |
| #2 | China | $24.8 | 198% |
| #3 | Japan | $19.5 | 22% |
| #4 | United Kingdom | $9.9 | -2% |
| #5 | Germany | $9.7 | 0% |
| #6 | India | $8.2 | 160% |
| #7 | France | $6.6 | -11% |
| #8 | Canada | $6.4 | 25% |
| #9 | Australia | $6.1 | 83% |
| #10 | Italy | $4.3 | -19% |
Over the last decade, China and India have more than doubled their wealth. Meanwhile, developed economies like the United States and Japan have increased wealth at modest rates – and some, like Italy and France, even lost modest amounts of private wealth over that duration of time.
Finally, it should be noted that the United Kingdom’s decrease above is mainly due to the depreciation of the GBP, which dropped in dollar terms from roughly $2.00 to $1.35 over the decade in question.
Future Projections
How is global wealth expected to shift in the future?
According to New World Wealth, the same 10 countries will dominate the landscape – but the order will change considerably over the next decade:
| Proj. Rank | Country | Proj. Wealth ($ Trillions, 2027) | Change (2017-2027, %) |
|---|---|---|---|
| #1 | United States | $75.1 | 20% |
| #2 | China | $69.4 | 180% |
| #3 | Japan | $25.4 | 30% |
| #4 | India | $24.7 | 200% |
| #5 | United Kingdom | $10.9 | 10% |
| #6 | Germany | $10.6 | 10% |
| #7 | Australia | $10.4 | 70% |
| #8 | Canada | $8.3 | 30% |
| #9 | France | $7.3 | 10% |
| #10 | Italy | $4.7 | 10% |
While the ranking order of the top three wealthiest countries will remain the same, India is expected to shoot up 200% to claim the #4 position with $24.7 trillion in private wealth.
Meanwhile, France and Australia are two other significant movers – and they are going opposite directions.
France will continue its descent down the ranking to 9th place with just 10% growth in a decade, and Australia will increase wealth at a rate that is very impressive for a developed economy. By 2027, it’s expected to be the world’s seventh richest country in terms of private wealth, with a total of $10.4 trillion. That will rival powerhouses like Germany and the United Kingdom, each with private wealth near the $11 trillion mark.
For more on private wealth, see the 15 wealthiest cities as well the countries that are gaining (or losing) wealth at the fastest rates.


Markets
U.S. Debt Interest Payments Reach $1 Trillion
U.S. debt interest payments have surged past the $1 trillion dollar mark, amid high interest rates and an ever-expanding debt burden.


U.S. Debt Interest Payments Reach $1 Trillion
This was originally posted on our Voronoi app. Download the app for free on iOS or Android and discover incredible data-driven charts from a variety of trusted sources.
The cost of paying for America’s national debt crossed the $1 trillion dollar mark in 2023, driven by high interest rates and a record $34 trillion mountain of debt.
Over the last decade, U.S. debt interest payments have more than doubled amid vast government spending during the pandemic crisis. As debt payments continue to soar, the Congressional Budget Office (CBO) reported that debt servicing costs surpassed defense spending for the first time ever this year.
This graphic shows the sharp rise in U.S. debt payments, based on data from the Federal Reserve.
A $1 Trillion Interest Bill, and Growing
Below, we show how U.S. debt interest payments have risen at a faster pace than at another time in modern history:
| Date | Interest Payments | U.S. National Debt |
|---|---|---|
| 2023 | $1.0T | $34.0T |
| 2022 | $830B | $31.4T |
| 2021 | $612B | $29.6T |
| 2020 | $518B | $27.7T |
| 2019 | $564B | $23.2T |
| 2018 | $571B | $22.0T |
| 2017 | $493B | $20.5T |
| 2016 | $460B | $20.0T |
| 2015 | $435B | $18.9T |
| 2014 | $442B | $18.1T |
| 2013 | $425B | $17.2T |
| 2012 | $417B | $16.4T |
| 2011 | $433B | $15.2T |
| 2010 | $400B | $14.0T |
| 2009 | $354B | $12.3T |
| 2008 | $380B | $10.7T |
| 2007 | $414B | $9.2T |
| 2006 | $387B | $8.7T |
| 2005 | $355B | $8.2T |
| 2004 | $318B | $7.6T |
| 2003 | $294B | $7.0T |
| 2002 | $298B | $6.4T |
| 2001 | $318B | $5.9T |
| 2000 | $353B | $5.7T |
| 1999 | $353B | $5.8T |
| 1998 | $360B | $5.6T |
| 1997 | $368B | $5.5T |
| 1996 | $362B | $5.3T |
| 1995 | $357B | $5.0T |
| 1994 | $334B | $4.8T |
| 1993 | $311B | $4.5T |
| 1992 | $306B | $4.2T |
| 1991 | $308B | $3.8T |
| 1990 | $298B | $3.4T |
| 1989 | $275B | $3.0T |
| 1988 | $254B | $2.7T |
| 1987 | $240B | $2.4T |
| 1986 | $225B | $2.2T |
| 1985 | $219B | $1.9T |
| 1984 | $205B | $1.7T |
| 1983 | $176B | $1.4T |
| 1982 | $157B | $1.2T |
| 1981 | $142B | $1.0T |
| 1980 | $113B | $930.2B |
| 1979 | $96B | $845.1B |
| 1978 | $84B | $789.2B |
| 1977 | $69B | $718.9B |
| 1976 | $61B | $653.5B |
| 1975 | $55B | $576.6B |
| 1974 | $50B | $492.7B |
| 1973 | $45B | $469.1B |
| 1972 | $39B | $448.5B |
| 1971 | $36B | $424.1B |
| 1970 | $35B | $389.2B |
| 1969 | $30B | $368.2B |
| 1968 | $25B | $358.0B |
| 1967 | $23B | $344.7B |
| 1966 | $21B | $329.3B |
Interest payments represent seasonally adjusted annual rate at the end of Q4.
At current rates, the U.S. national debt is growing by a remarkable $1 trillion about every 100 days, equal to roughly $3.6 trillion per year.
As the national debt has ballooned, debt payments even exceeded Medicaid outlays in 2023—one of the government’s largest expenditures. On average, the U.S. spent more than $2 billion per day on interest costs last year. Going further, the U.S. government is projected to spend a historic $12.4 trillion on interest payments over the next decade, averaging about $37,100 per American.
Exacerbating matters is that the U.S. is running a steep deficit, which stood at $1.1 trillion for the first six months of fiscal 2024. This has accelerated due to the 43% increase in debt servicing costs along with a $31 billion dollar increase in defense spending from a year earlier. Additionally, a $30 billion increase in funding for the Federal Deposit Insurance Corporation in light of the regional banking crisis last year was a major contributor to the deficit increase.
Overall, the CBO forecasts that roughly 75% of the federal deficit’s increase will be due to interest costs by 2034.

-

 Real Estate2 weeks ago
Visualizing America’s Shortage of Affordable Homes
-

 Technology1 week ago
Ranked: Semiconductor Companies by Industry Revenue Share
-

 Money1 week ago
Which States Have the Highest Minimum Wage in America?
-

 Real Estate1 week ago
Ranked: The Most Valuable Housing Markets in America
-

 Business1 week ago
Charted: Big Four Market Share by S&P 500 Audits
-

 AI1 week ago
The Stock Performance of U.S. Chipmakers So Far in 2024
-

 Misc2 weeks ago
Almost Every EV Stock is Down After Q1 2024
-

 Money2 weeks ago
Where Does One U.S. Tax Dollar Go?