Markets
Chart: The Slow Death of Traditional Media
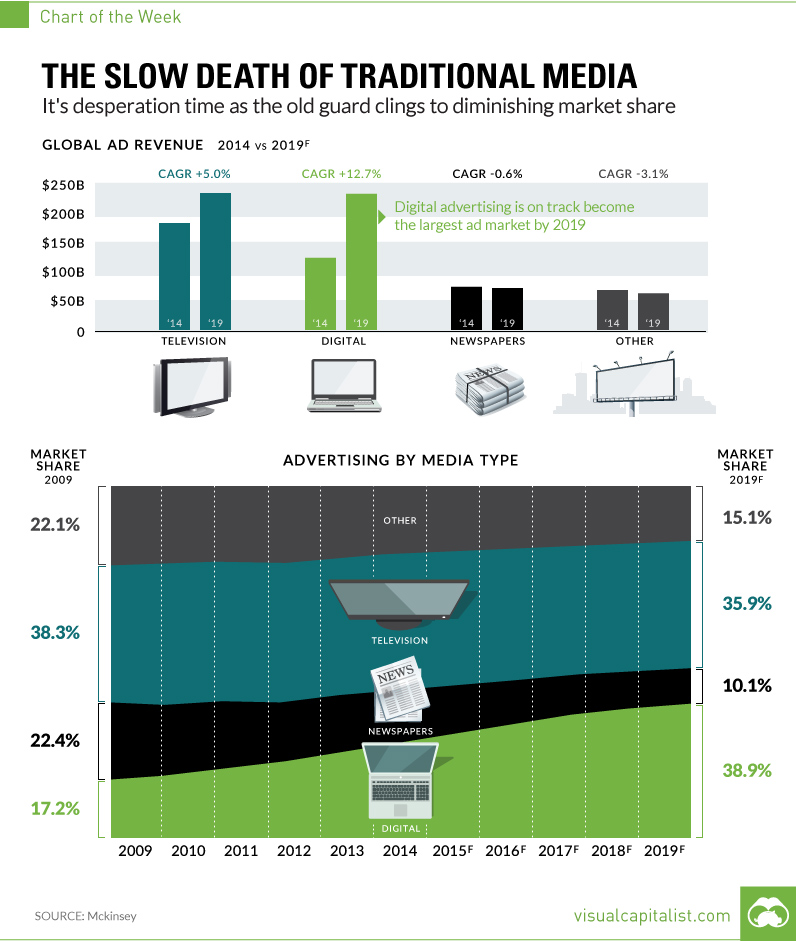
The Slow Death of Traditional Media
Desperation time as old guard clings to falling market share
The Chart of the Week is a weekly Visual Capitalist feature on Fridays.
Bill Gates once famously said that we systematically overestimate the change that will occur in two years, while underestimating the change that will come in the next ten.
The ongoing conversation about the death of legacy media definitely fits that mold.
Over the last five to ten years, people have been talking about how the newspaper, magazine, or radio station would become all but obsolete. And while certainly things have changed in all of these industries, it’s clear that there has not been a full paradigm shift yet.
Here is the evidence that we have finally reached that inflection point.
Fixing the Plane
In a recent interview at the City University of New York’s journalism school, Ken Lerer described the challenges of traditional media as follows:
You have to fix the plane while you’re flying it.
Lerer, a co-founder of the Huffington Post and currently the Chairman for Buzzfeed, is alluding to the fact that legacy media has to maintain old business models based on subscription and print ad revenue, while successfully venturing into the digital world. The latter category is already hard enough, even without taking into account the balancing act of the former.
The moral of the story? Some of these “planes” are going to land safely, but most of them are going to crash and burn.
The cost structure of legacy media just doesn’t make sense in today’s digital world. Overhead is high, and revenue is harder to find due to the limited success of paywalls, rampant ad blocking, and the steady fall in display ad prices due to the emergence of programmatic bidding.
Legacy Revenues
Why has legacy media been so slow to adopt change? Why don’t they just lay off half of their staff, ditch print operations, and start from scratch?
It’s because their major revenue sources are as slow at adopting as they are.
In 2015, there was only one age demographic with more than half of its constituents reading a daily newspaper, and that was “65 years old and up”:
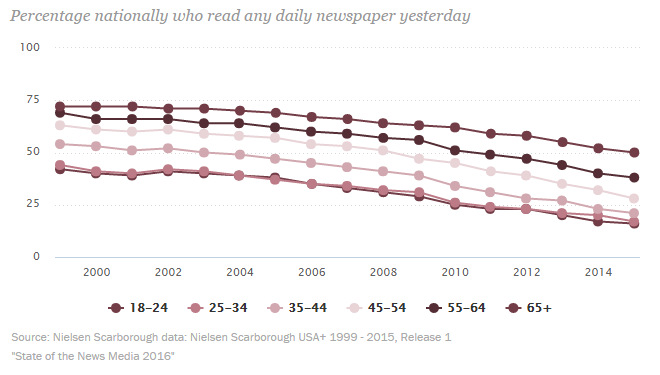
That said, the people that still read newspapers are among the wealthiest people in the country. Warren Buffett, for example, reads five a day. But even he does not know how to save the print industry from its woes.
Meanwhile, Madison Avenue has been notoriously slow at evolving to meet the needs of the digital revolution. If the biggest advertisers are still demanding the status quo, it makes it very difficult to “fix the plane”.
New Models
The most noticeable signal of change, however, is the relative success of new media companies such as Vice, Buzzfeed, and Vox – and the fact that some of their largest backers are from the old guard.
All of the above companies are “unicorns” valued at $1 billion or more by private investors, which include venture capital stalwarts such as Andreessen Horowitz, Accel Partners, Khosla Ventures, RRE Ventures, or Lerer Hippeau.
More importantly, however, they’ve also posted strategic investments from legacy media companies that are trying to wisely hedge their bets. Some of these include NBC Universal, The Walt Disney Company, 21st Century Fox, and Hearst.
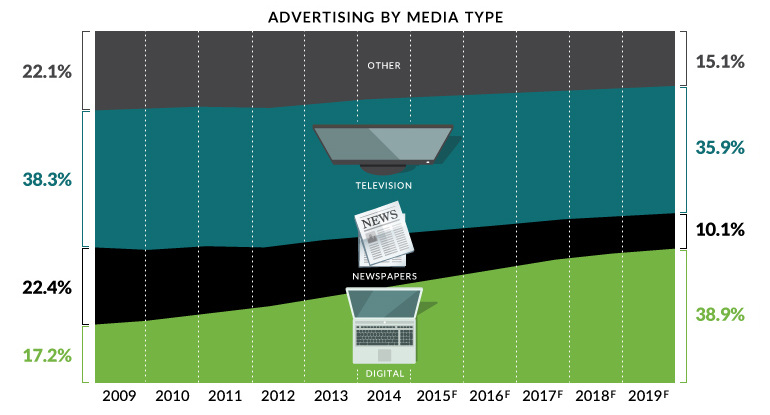
Digital will become the largest channel for ad revenue globally by 2019 – investors and companies that believe in the media business should position themselves accordingly.


Markets
U.S. Debt Interest Payments Reach $1 Trillion
U.S. debt interest payments have surged past the $1 trillion dollar mark, amid high interest rates and an ever-expanding debt burden.


U.S. Debt Interest Payments Reach $1 Trillion
This was originally posted on our Voronoi app. Download the app for free on iOS or Android and discover incredible data-driven charts from a variety of trusted sources.
The cost of paying for America’s national debt crossed the $1 trillion dollar mark in 2023, driven by high interest rates and a record $34 trillion mountain of debt.
Over the last decade, U.S. debt interest payments have more than doubled amid vast government spending during the pandemic crisis. As debt payments continue to soar, the Congressional Budget Office (CBO) reported that debt servicing costs surpassed defense spending for the first time ever this year.
This graphic shows the sharp rise in U.S. debt payments, based on data from the Federal Reserve.
A $1 Trillion Interest Bill, and Growing
Below, we show how U.S. debt interest payments have risen at a faster pace than at another time in modern history:
| Date | Interest Payments | U.S. National Debt |
|---|---|---|
| 2023 | $1.0T | $34.0T |
| 2022 | $830B | $31.4T |
| 2021 | $612B | $29.6T |
| 2020 | $518B | $27.7T |
| 2019 | $564B | $23.2T |
| 2018 | $571B | $22.0T |
| 2017 | $493B | $20.5T |
| 2016 | $460B | $20.0T |
| 2015 | $435B | $18.9T |
| 2014 | $442B | $18.1T |
| 2013 | $425B | $17.2T |
| 2012 | $417B | $16.4T |
| 2011 | $433B | $15.2T |
| 2010 | $400B | $14.0T |
| 2009 | $354B | $12.3T |
| 2008 | $380B | $10.7T |
| 2007 | $414B | $9.2T |
| 2006 | $387B | $8.7T |
| 2005 | $355B | $8.2T |
| 2004 | $318B | $7.6T |
| 2003 | $294B | $7.0T |
| 2002 | $298B | $6.4T |
| 2001 | $318B | $5.9T |
| 2000 | $353B | $5.7T |
| 1999 | $353B | $5.8T |
| 1998 | $360B | $5.6T |
| 1997 | $368B | $5.5T |
| 1996 | $362B | $5.3T |
| 1995 | $357B | $5.0T |
| 1994 | $334B | $4.8T |
| 1993 | $311B | $4.5T |
| 1992 | $306B | $4.2T |
| 1991 | $308B | $3.8T |
| 1990 | $298B | $3.4T |
| 1989 | $275B | $3.0T |
| 1988 | $254B | $2.7T |
| 1987 | $240B | $2.4T |
| 1986 | $225B | $2.2T |
| 1985 | $219B | $1.9T |
| 1984 | $205B | $1.7T |
| 1983 | $176B | $1.4T |
| 1982 | $157B | $1.2T |
| 1981 | $142B | $1.0T |
| 1980 | $113B | $930.2B |
| 1979 | $96B | $845.1B |
| 1978 | $84B | $789.2B |
| 1977 | $69B | $718.9B |
| 1976 | $61B | $653.5B |
| 1975 | $55B | $576.6B |
| 1974 | $50B | $492.7B |
| 1973 | $45B | $469.1B |
| 1972 | $39B | $448.5B |
| 1971 | $36B | $424.1B |
| 1970 | $35B | $389.2B |
| 1969 | $30B | $368.2B |
| 1968 | $25B | $358.0B |
| 1967 | $23B | $344.7B |
| 1966 | $21B | $329.3B |
Interest payments represent seasonally adjusted annual rate at the end of Q4.
At current rates, the U.S. national debt is growing by a remarkable $1 trillion about every 100 days, equal to roughly $3.6 trillion per year.
As the national debt has ballooned, debt payments even exceeded Medicaid outlays in 2023—one of the government’s largest expenditures. On average, the U.S. spent more than $2 billion per day on interest costs last year. Going further, the U.S. government is projected to spend a historic $12.4 trillion on interest payments over the next decade, averaging about $37,100 per American.
Exacerbating matters is that the U.S. is running a steep deficit, which stood at $1.1 trillion for the first six months of fiscal 2024. This has accelerated due to the 43% increase in debt servicing costs along with a $31 billion dollar increase in defense spending from a year earlier. Additionally, a $30 billion increase in funding for the Federal Deposit Insurance Corporation in light of the regional banking crisis last year was a major contributor to the deficit increase.
Overall, the CBO forecasts that roughly 75% of the federal deficit’s increase will be due to interest costs by 2034.

-

 Maps2 weeks ago
Mapped: Average Wages Across Europe
-

 Money1 week ago
Which States Have the Highest Minimum Wage in America?
-

 Real Estate1 week ago
Ranked: The Most Valuable Housing Markets in America
-

 Markets1 week ago
Charted: Big Four Market Share by S&P 500 Audits
-

 AI1 week ago
The Stock Performance of U.S. Chipmakers So Far in 2024
-

 Automotive2 weeks ago
Almost Every EV Stock is Down After Q1 2024
-

 Money2 weeks ago
Where Does One U.S. Tax Dollar Go?
-

 Green2 weeks ago
Ranked: Top Countries by Total Forest Loss Since 2001