Technology
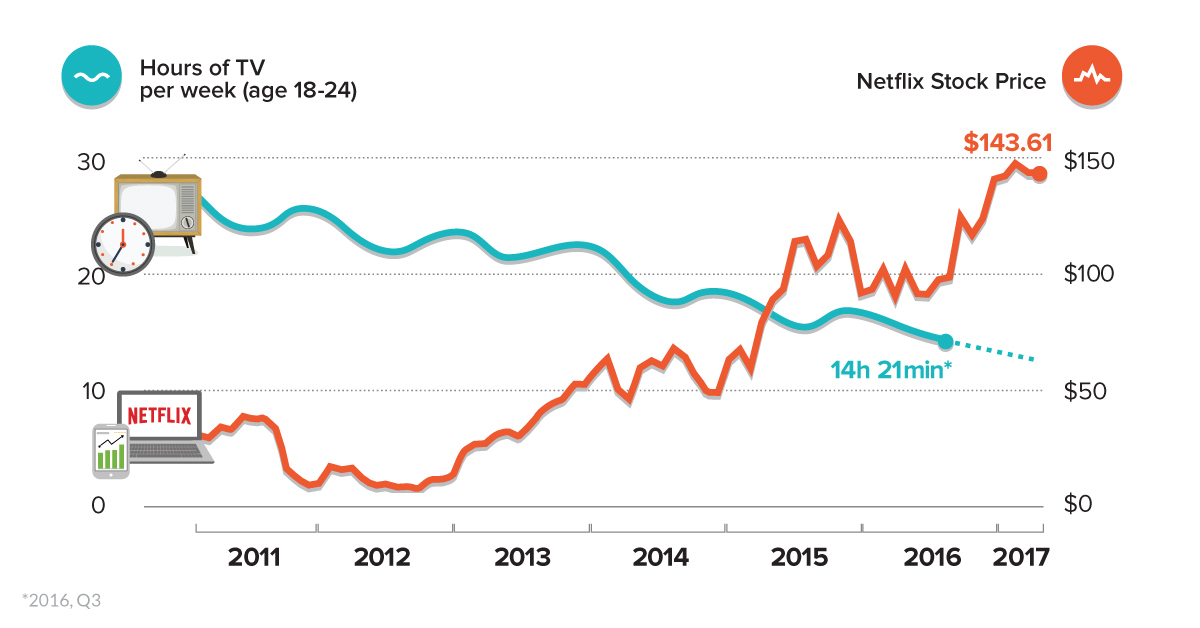
Chart: The Netflix Generation

Chart: The Netflix Generation
Millennials, streaming platforms, and the slow death of cable television
The Chart of the Week is a weekly Visual Capitalist feature on Fridays.
Since launching in the United States in 1948, cable television quickly emerged as the media consumption method of choice for families around the world.
Cable brought to us some of the most memorable and noteworthy events in history. People saw the fall of the Berlin Wall from their living rooms in 1989 – and many even remember being inspired by Neil Armstrong taking his first steps on the moon twenty years earlier.
And although television is still a vital medium today, it is also stuck in an inevitable quagmire. Digital already generates more ad revenue than television, while more people switch to streaming platforms every day.
Make no mistake – even though there is still plenty of money to be made in television, cable is experiencing a slow death, just like other traditional media channels. It might not yet be reduced to the more niche territory of radio or print, but cable is treading the same path.
The Digital Natives
Why this is the case is very simple math.
Even just six years ago in 2011, the average 18-24 year old millennial consumed about 25 hours of traditional television per week – today, they consume closer to 14 hours.
That said, it’s no surprise that the first generation of digital natives skews heavily towards digital content, but what will be even more interesting is the behavior of the next generation on deck: Gen Z (born in 2000 and onwards). This cohort was born into a world of screens and iPhones, and will not be aware of a prior era. To them, flipping through channels on cable television seems even more antiquated and arbitrary than it does to older generations.
Gen Z watches between two and four hours of YouTube and less than an hour of traditional television per day. They’re also twice more likely to use YouTube than Millennials, and a lot less likely to use Facebook.
– Shireen Jiwan, chief brand experience officer at Lucky Brand
Less than an hour per day is not very conducive to the cable business, especially when there are hundreds of channels in existence today. And while insights on Gen Z are still fluid and evolving, it’s highly doubtful that the generation will do a 360 on video anytime soon.
In the meantime, cable’s survival as a dominant medium rests squarely on the shoulders of older generations. While it works as a business for now, cable can’t fight the demographics forever.


Technology
Ranked: Semiconductor Companies by Industry Revenue Share
Nvidia is coming for Intel’s crown. Samsung is losing ground. AI is transforming the space. We break down revenue for semiconductor companies.


Semiconductor Companies by Industry Revenue Share
This was originally posted on our Voronoi app. Download the app for free on Apple or Android and discover incredible data-driven charts from a variety of trusted sources.
Did you know that some computer chips are now retailing for the price of a new BMW?
As computers invade nearly every sphere of life, so too have the chips that power them, raising the revenues of the businesses dedicated to designing them.
But how did various chipmakers measure against each other last year?
We rank the biggest semiconductor companies by their percentage share of the industry’s revenues in 2023, using data from Omdia research.
Which Chip Company Made the Most Money in 2023?
Market leader and industry-defining veteran Intel still holds the crown for the most revenue in the sector, crossing $50 billion in 2023, or 10% of the broader industry’s topline.
All is not well at Intel, however, with the company’s stock price down over 20% year-to-date after it revealed billion-dollar losses in its foundry business.
| Rank | Company | 2023 Revenue | % of Industry Revenue |
|---|---|---|---|
| 1 | Intel | $51B | 9.4% |
| 2 | NVIDIA | $49B | 9.0% |
| 3 | Samsung Electronics | $44B | 8.1% |
| 4 | Qualcomm | $31B | 5.7% |
| 5 | Broadcom | $28B | 5.2% |
| 6 | SK Hynix | $24B | 4.4% |
| 7 | AMD | $22B | 4.1% |
| 8 | Apple | $19B | 3.4% |
| 9 | Infineon Tech | $17B | 3.2% |
| 10 | STMicroelectronics | $17B | 3.2% |
| 11 | Texas Instruments | $17B | 3.1% |
| 12 | Micron Technology | $16B | 2.9% |
| 13 | MediaTek | $14B | 2.6% |
| 14 | NXP | $13B | 2.4% |
| 15 | Analog Devices | $12B | 2.2% |
| 16 | Renesas Electronics Corporation | $11B | 1.9% |
| 17 | Sony Semiconductor Solutions Corporation | $10B | 1.9% |
| 18 | Microchip Technology | $8B | 1.5% |
| 19 | Onsemi | $8B | 1.4% |
| 20 | KIOXIA Corporation | $7B | 1.3% |
| N/A | Others | $126B | 23.2% |
| N/A | Total | $545B | 100% |
Note: Figures are rounded. Totals and percentages may not sum to 100.
Meanwhile, Nvidia is very close to overtaking Intel, after declaring $49 billion of topline revenue for 2023. This is more than double its 2022 revenue ($21 billion), increasing its share of industry revenues to 9%.
Nvidia’s meteoric rise has gotten a huge thumbs-up from investors. It became a trillion dollar stock last year, and broke the single-day gain record for market capitalization this year.
Other chipmakers haven’t been as successful. Out of the top 20 semiconductor companies by revenue, 12 did not match their 2022 revenues, including big names like Intel, Samsung, and AMD.
The Many Different Types of Chipmakers
All of these companies may belong to the same industry, but they don’t focus on the same niche.
According to Investopedia, there are four major types of chips, depending on their functionality: microprocessors, memory chips, standard chips, and complex systems on a chip.
Nvidia’s core business was once GPUs for computers (graphics processing units), but in recent years this has drastically shifted towards microprocessors for analytics and AI.
These specialized chips seem to be where the majority of growth is occurring within the sector. For example, companies that are largely in the memory segment—Samsung, SK Hynix, and Micron Technology—saw peak revenues in the mid-2010s.

-

 Real Estate2 weeks ago
Visualizing America’s Shortage of Affordable Homes
-

 Technology1 week ago
Ranked: Semiconductor Companies by Industry Revenue Share
-

 Money1 week ago
Which States Have the Highest Minimum Wage in America?
-

 Real Estate1 week ago
Ranked: The Most Valuable Housing Markets in America
-

 Business1 week ago
Charted: Big Four Market Share by S&P 500 Audits
-

 AI1 week ago
The Stock Performance of U.S. Chipmakers So Far in 2024
-

 Misc2 weeks ago
Almost Every EV Stock is Down After Q1 2024
-

 Money2 weeks ago
Where Does One U.S. Tax Dollar Go?