Markets
Chart: Where is Global Growth Happening?
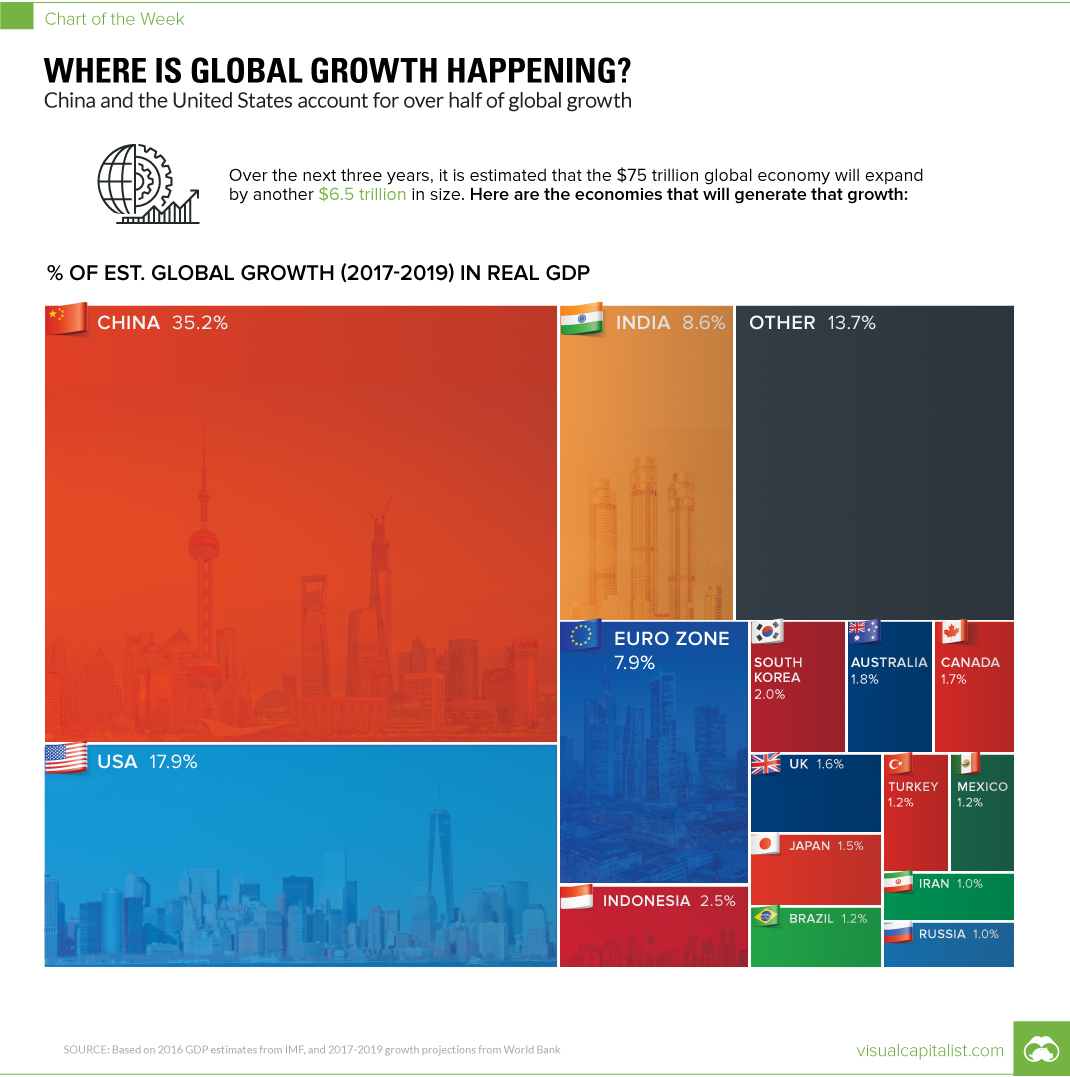
Chart: Where is Global Growth Happening?
China and U.S. still generating >50% of Real GDP growth
The Chart of the Week is a weekly Visual Capitalist feature on Fridays.
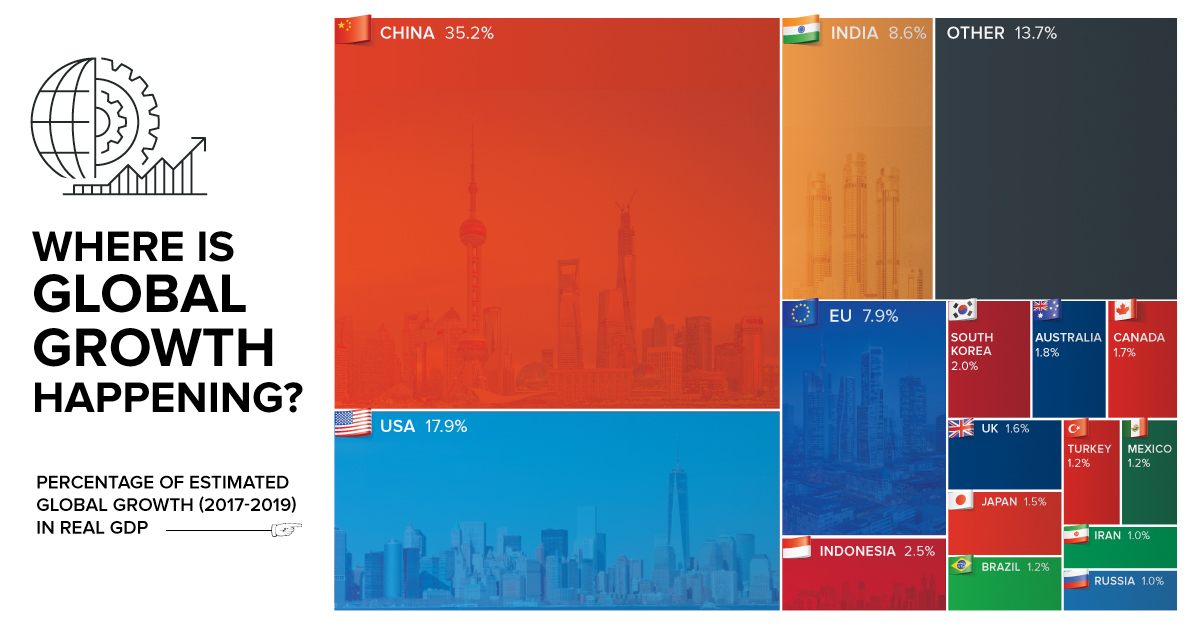
According to forecasts from earlier this year by the World Bank, the global economy is expected to average a Real GDP growth rate of 2.8% between 2017-2019.
But where will this growth actually happen? Is it in giant countries that are growing at a stable 2% clip, or is it occurring in the smaller emerging markets where 8% growth is not uncommon?
Today’s chart looks at individual countries between 2017-2019, based on their individual growth projections from the World Bank, to see where new wealth is being created.
China Still Tops
Even though growth has slowed in China somewhat, the World Bank still estimates its economy to expand at a 6.5% clip this year, and 6.3% in both 2018 and 2019.
Add these numbers onto the world’s second biggest economy (and the biggest in PPP terms), and you have an incredible amount of growth. In fact, about 35.2% of global GDP growth will come from China over this period of time, putting the country’s economic output $2.3 trillion higher.
Uncertainty in the U.S.
While the U.S. is also expected to contribute a significant portion of global growth, the World Bank had a fairly ominous caveat to their projections over coming years.
The U.S. forecasts do not incorporate the effect of policy proposals by the new U.S. administration, as their overall scope and ultimate form are still uncertain.
– World Bank, Global Outlook Summary
That said, the World Bank does also mention that the tax cuts proposed by the Trump administration could theoretically bump up U.S. and global growth if implemented. However, with all of the chaos in the current U.S. political environment, the tax cuts have been delayed for now – and some analysts are scaling back the chances of them even happening at all.
Other Growth Hotbeds
Beyond the usual suspects of China, India, the Eurozone, and the U.S., it is interesting to see Indonesia as the next biggest bright spot using this type of analysis.
In fact, the world’s fourth most populous nation will account for 2.5% of global GDP growth over the aforementioned time period, adding another $160 billion to its $941 billion GDP. The World Bank projects growth for the country at 5.3% this year, and 5.5% for the next two years.
The other countries that registered as providing 1% or more of global growth?
They include: South Korea (2.0%), Australia (1.8%), Canada (1.7%), UK (1.6%), Japan (1.5%), Brazil (1.2%), Turkey (1.2%), Mexico (1.2%), Russia (1.0%), and Iran (1.0%).
–
Correction: A previous version of the chart was incorrectly labeled “EU”. That portion of the tree map has been updated to Euro Zone.


Markets
U.S. Debt Interest Payments Reach $1 Trillion
U.S. debt interest payments have surged past the $1 trillion dollar mark, amid high interest rates and an ever-expanding debt burden.


U.S. Debt Interest Payments Reach $1 Trillion
This was originally posted on our Voronoi app. Download the app for free on iOS or Android and discover incredible data-driven charts from a variety of trusted sources.
The cost of paying for America’s national debt crossed the $1 trillion dollar mark in 2023, driven by high interest rates and a record $34 trillion mountain of debt.
Over the last decade, U.S. debt interest payments have more than doubled amid vast government spending during the pandemic crisis. As debt payments continue to soar, the Congressional Budget Office (CBO) reported that debt servicing costs surpassed defense spending for the first time ever this year.
This graphic shows the sharp rise in U.S. debt payments, based on data from the Federal Reserve.
A $1 Trillion Interest Bill, and Growing
Below, we show how U.S. debt interest payments have risen at a faster pace than at another time in modern history:
| Date | Interest Payments | U.S. National Debt |
|---|---|---|
| 2023 | $1.0T | $34.0T |
| 2022 | $830B | $31.4T |
| 2021 | $612B | $29.6T |
| 2020 | $518B | $27.7T |
| 2019 | $564B | $23.2T |
| 2018 | $571B | $22.0T |
| 2017 | $493B | $20.5T |
| 2016 | $460B | $20.0T |
| 2015 | $435B | $18.9T |
| 2014 | $442B | $18.1T |
| 2013 | $425B | $17.2T |
| 2012 | $417B | $16.4T |
| 2011 | $433B | $15.2T |
| 2010 | $400B | $14.0T |
| 2009 | $354B | $12.3T |
| 2008 | $380B | $10.7T |
| 2007 | $414B | $9.2T |
| 2006 | $387B | $8.7T |
| 2005 | $355B | $8.2T |
| 2004 | $318B | $7.6T |
| 2003 | $294B | $7.0T |
| 2002 | $298B | $6.4T |
| 2001 | $318B | $5.9T |
| 2000 | $353B | $5.7T |
| 1999 | $353B | $5.8T |
| 1998 | $360B | $5.6T |
| 1997 | $368B | $5.5T |
| 1996 | $362B | $5.3T |
| 1995 | $357B | $5.0T |
| 1994 | $334B | $4.8T |
| 1993 | $311B | $4.5T |
| 1992 | $306B | $4.2T |
| 1991 | $308B | $3.8T |
| 1990 | $298B | $3.4T |
| 1989 | $275B | $3.0T |
| 1988 | $254B | $2.7T |
| 1987 | $240B | $2.4T |
| 1986 | $225B | $2.2T |
| 1985 | $219B | $1.9T |
| 1984 | $205B | $1.7T |
| 1983 | $176B | $1.4T |
| 1982 | $157B | $1.2T |
| 1981 | $142B | $1.0T |
| 1980 | $113B | $930.2B |
| 1979 | $96B | $845.1B |
| 1978 | $84B | $789.2B |
| 1977 | $69B | $718.9B |
| 1976 | $61B | $653.5B |
| 1975 | $55B | $576.6B |
| 1974 | $50B | $492.7B |
| 1973 | $45B | $469.1B |
| 1972 | $39B | $448.5B |
| 1971 | $36B | $424.1B |
| 1970 | $35B | $389.2B |
| 1969 | $30B | $368.2B |
| 1968 | $25B | $358.0B |
| 1967 | $23B | $344.7B |
| 1966 | $21B | $329.3B |
Interest payments represent seasonally adjusted annual rate at the end of Q4.
At current rates, the U.S. national debt is growing by a remarkable $1 trillion about every 100 days, equal to roughly $3.6 trillion per year.
As the national debt has ballooned, debt payments even exceeded Medicaid outlays in 2023—one of the government’s largest expenditures. On average, the U.S. spent more than $2 billion per day on interest costs last year. Going further, the U.S. government is projected to spend a historic $12.4 trillion on interest payments over the next decade, averaging about $37,100 per American.
Exacerbating matters is that the U.S. is running a steep deficit, which stood at $1.1 trillion for the first six months of fiscal 2024. This has accelerated due to the 43% increase in debt servicing costs along with a $31 billion dollar increase in defense spending from a year earlier. Additionally, a $30 billion increase in funding for the Federal Deposit Insurance Corporation in light of the regional banking crisis last year was a major contributor to the deficit increase.
Overall, the CBO forecasts that roughly 75% of the federal deficit’s increase will be due to interest costs by 2034.

-

 Green2 weeks ago
Ranked: Top Countries by Total Forest Loss Since 2001
-

 Travel1 week ago
Ranked: The World’s Top Flight Routes, by Revenue
-

 Technology1 week ago
Ranked: Semiconductor Companies by Industry Revenue Share
-

 Money2 weeks ago
Which States Have the Highest Minimum Wage in America?
-

 Real Estate2 weeks ago
Ranked: The Most Valuable Housing Markets in America
-

 Markets2 weeks ago
Charted: Big Four Market Share by S&P 500 Audits
-

 AI2 weeks ago
The Stock Performance of U.S. Chipmakers So Far in 2024
-

 Automotive2 weeks ago
Almost Every EV Stock is Down After Q1 2024