Markets
Chart: The Epic Collapse of Deutsche Bank
The Epic Collapse of Deutsche Bank [Chart]
A timeline showing the fall of one of Europe’s most iconic financial institutions
The Chart of the Week is a weekly Visual Capitalist feature on Fridays.
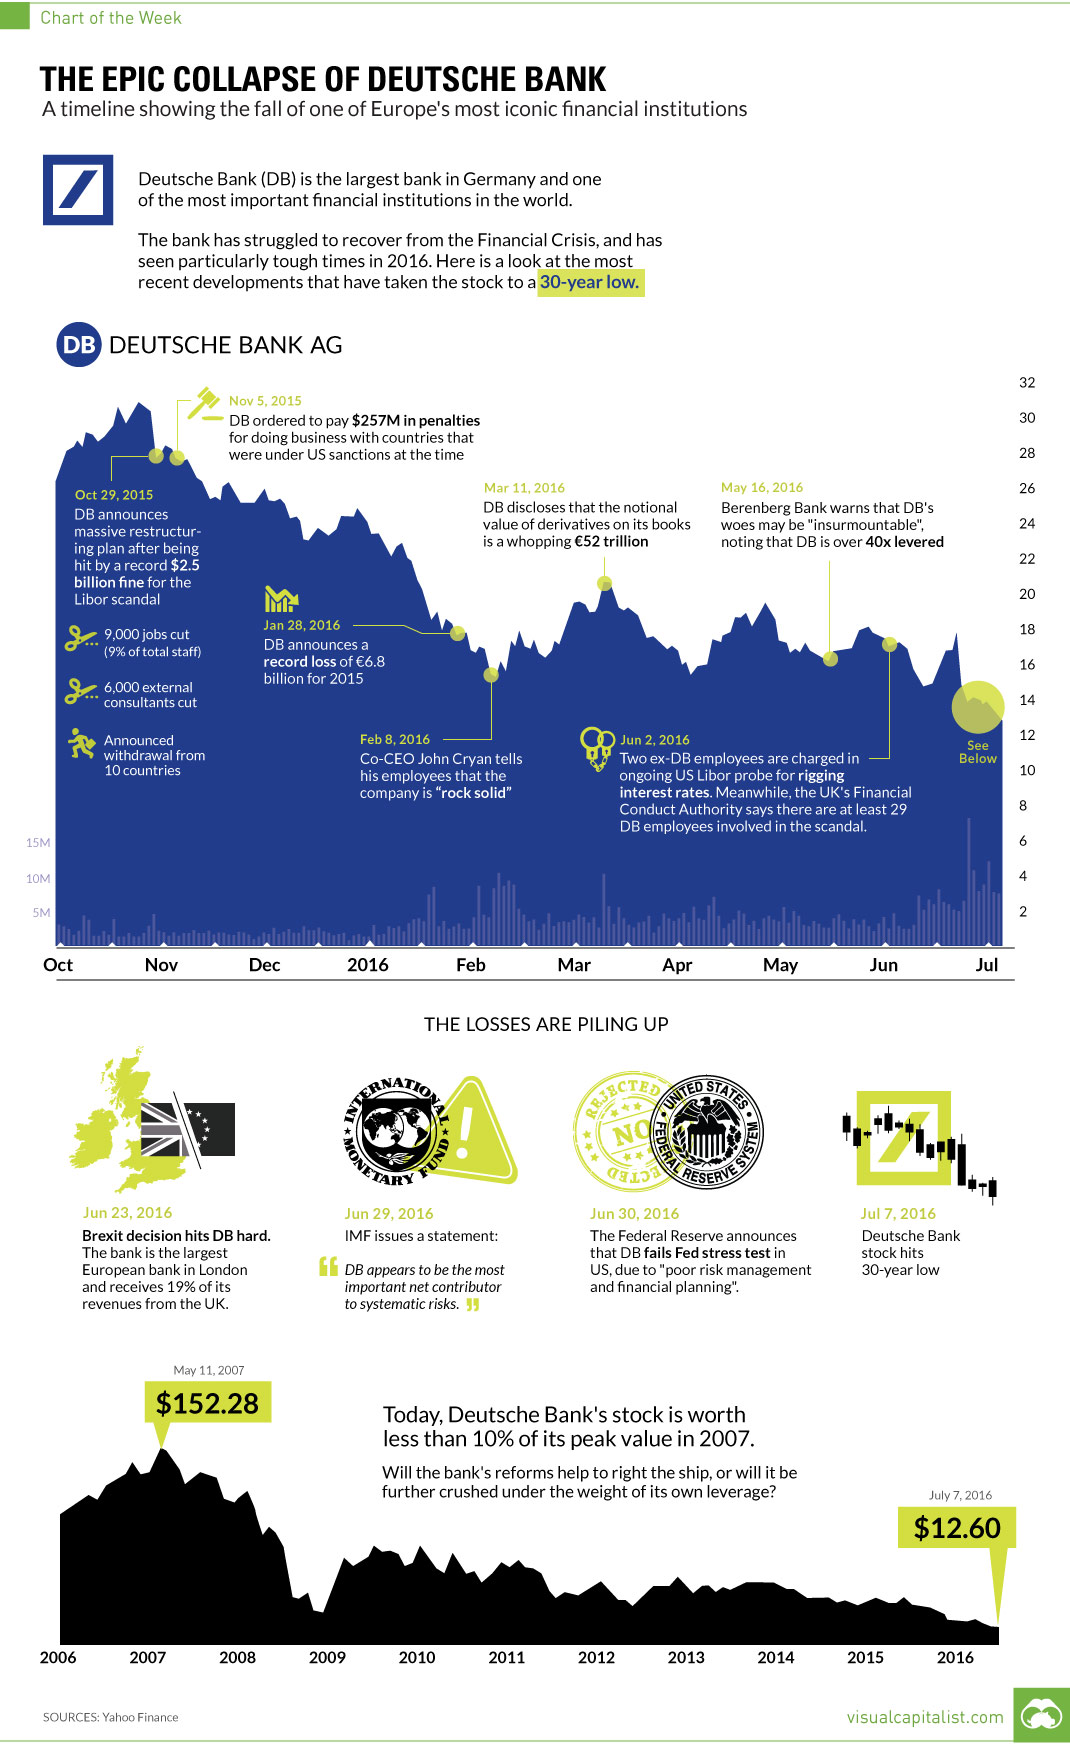
It’s been almost 10 years in the making, but the fate of one of Europe’s most important financial institutions appears to be sealed.
After a hard-hitting sequence of scandals, poor decisions, and unfortunate events, Frankfurt-based Deutsche Bank shares are now down -48% on the year to $12.60, which is a record-setting low.
Even more stunning is the long-term view of the German institution’s downward spiral.
With a modest $15.8 billion in market capitalization, shares of the 147-year-old company now trade for a paltry 8% of its peak price in May 2007.
The Beginning of the End
If the deaths of Lehman Brothers and Bear Stearns were quick and painless, the coming demise of Deutsche Bank has been long, drawn out, and painful.
In recent times, Deutsche Bank’s investment banking division has been among the largest in the world, comparable in size to Goldman Sachs, JP Morgan, Bank of America, and Citigroup. However, unlike those other names, Deutsche Bank has been walking wounded since the Financial Crisis, and the German bank has never been able to fully recover.
It’s ironic, because in 2009, the company’s CEO Josef Ackermann boldly proclaimed that Deutsche Bank had plenty of capital, and that it was weathering the crisis better than its competitors.
It turned out, however, that the bank was actually hiding $12 billion in losses to avoid a government bailout. Meanwhile, much of the money the bank did make during this turbulent time in the markets stemmed from the manipulation of Libor rates. Those “wins” were short-lived, since the eventual fine to end the Libor probe would be a record-setting $2.5 billion.
The bank finally had to admit that it actually needed more capital.
In 2013, it raised €3 billion with a rights issue, claiming that no additional funds would be needed. Then in 2014 the bank head-scratchingly proceeded to raise €1.5 billion, and after that, another €8 billion.
A Series of Unfortunate Events
In recent years, Deutsche Bank has desperately been trying to reinvent itself.
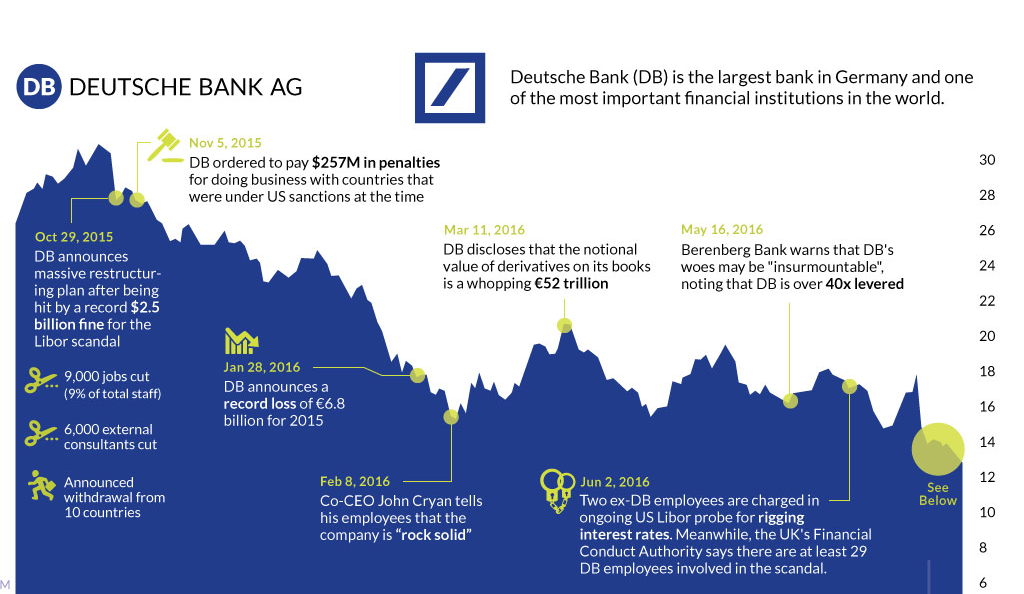
Having gone through multiple CEOs since the Financial Crisis, the latest attempt at reinvention involves a massive overhaul of operations and staff announced by co-CEO John Cryan in October 2015. The bank is now in the process of cutting 9,000 employees and ceasing operations in 10 countries. This is where our timeline of Deutsche Bank’s most recent woes begins – and the last six months, in particular, have been fast and furious.
Deutsche Bank started the year by announcing a record-setting loss in 2015 of €6.8 billion.
Cryan went on an immediate PR binge, proclaiming that the bank was “rock solid”. German Finance Minister Wolfgang Schäuble even went out of his way to say he had “no concerns” about Deutsche Bank.
Translation: things are in full-on crisis mode.
In the following weeks, here’s what happened:
- May 16, 2016: Berenberg Bank warns that DB’s woes may be “insurmountable”, noting that DB is more than 40x levered.
- June 2, 2016: Two ex-DB employees are charged in ongoing U.S. Libor probe for rigging interest rates. Meanwhile, the UK’s Financial Conduct Authority says there are at least 29 DB employees involved in the scandal.
- June 23, 2016: Brexit decision hits DB hard. The bank is the largest European bank in London and receives 19% of its revenues from the UK.
- June 29, 2016: IMF issues statement that “DB appears to be the most important net contributor to systemic risks”.
- June 30, 2016: Federal Reserve announces that DB fails Fed stress test in US, due to “poor risk management and financial planning”.
Doesn’t sound “rock solid”, does it?
Now the real question: what happens to Deutsche Bank’s derivative book, which has a notional value of €52 trillion, if the bank is insolvent?


Economy
Economic Growth Forecasts for G7 and BRICS Countries in 2024
The IMF has released its economic growth forecasts for 2024. How do the G7 and BRICS countries compare?


G7 & BRICS Real GDP Growth Forecasts for 2024
The International Monetary Fund’s (IMF) has released its real gross domestic product (GDP) growth forecasts for 2024, and while global growth is projected to stay steady at 3.2%, various major nations are seeing declining forecasts.
This chart visualizes the 2024 real GDP growth forecasts using data from the IMF’s 2024 World Economic Outlook for G7 and BRICS member nations along with Saudi Arabia, which is still considering an invitation to join the bloc.
Get the Key Insights of the IMF’s World Economic Outlook
Want a visual breakdown of the insights from the IMF’s 2024 World Economic Outlook report?
This visual is part of a special dispatch of the key takeaways exclusively for VC+ members.
Get the full dispatch of charts by signing up to VC+.
Mixed Economic Growth Prospects for Major Nations in 2024
Economic growth projections by the IMF for major nations are mixed, with the majority of G7 and BRICS countries forecasted to have slower growth in 2024 compared to 2023.
Only three BRICS-invited or member countries, Saudi Arabia, the UAE, and South Africa, have higher projected real GDP growth rates in 2024 than last year.
| Group | Country | Real GDP Growth (2023) | Real GDP Growth (2024P) |
|---|---|---|---|
| G7 | 🇺🇸 U.S. | 2.5% | 2.7% |
| G7 | 🇨🇦 Canada | 1.1% | 1.2% |
| G7 | 🇯🇵 Japan | 1.9% | 0.9% |
| G7 | 🇫🇷 France | 0.9% | 0.7% |
| G7 | 🇮🇹 Italy | 0.9% | 0.7% |
| G7 | 🇬🇧 UK | 0.1% | 0.5% |
| G7 | 🇩🇪 Germany | -0.3% | 0.2% |
| BRICS | 🇮🇳 India | 7.8% | 6.8% |
| BRICS | 🇨🇳 China | 5.2% | 4.6% |
| BRICS | 🇦🇪 UAE | 3.4% | 3.5% |
| BRICS | 🇮🇷 Iran | 4.7% | 3.3% |
| BRICS | 🇷🇺 Russia | 3.6% | 3.2% |
| BRICS | 🇪🇬 Egypt | 3.8% | 3.0% |
| BRICS-invited | 🇸🇦 Saudi Arabia | -0.8% | 2.6% |
| BRICS | 🇧🇷 Brazil | 2.9% | 2.2% |
| BRICS | 🇿🇦 South Africa | 0.6% | 0.9% |
| BRICS | 🇪🇹 Ethiopia | 7.2% | 6.2% |
| 🌍 World | 3.2% | 3.2% |
China and India are forecasted to maintain relatively high growth rates in 2024 at 4.6% and 6.8% respectively, but compared to the previous year, China is growing 0.6 percentage points slower while India is an entire percentage point slower.
On the other hand, four G7 nations are set to grow faster than last year, which includes Germany making its comeback from its negative real GDP growth of -0.3% in 2023.
Faster Growth for BRICS than G7 Nations
Despite mostly lower growth forecasts in 2024 compared to 2023, BRICS nations still have a significantly higher average growth forecast at 3.6% compared to the G7 average of 1%.
While the G7 countries’ combined GDP is around $15 trillion greater than the BRICS nations, with continued higher growth rates and the potential to add more members, BRICS looks likely to overtake the G7 in economic size within two decades.
BRICS Expansion Stutters Before October 2024 Summit
BRICS’ recent expansion has stuttered slightly, as Argentina’s newly-elected president Javier Milei declined its invitation and Saudi Arabia clarified that the country is still considering its invitation and has not joined BRICS yet.
Even with these initial growing pains, South Africa’s Foreign Minister Naledi Pandor told reporters in February that 34 different countries have submitted applications to join the growing BRICS bloc.
Any changes to the group are likely to be announced leading up to or at the 2024 BRICS summit which takes place October 22-24 in Kazan, Russia.
Get the Full Analysis of the IMF’s Outlook on VC+
This visual is part of an exclusive special dispatch for VC+ members which breaks down the key takeaways from the IMF’s 2024 World Economic Outlook.
For the full set of charts and analysis, sign up for VC+.

-

 Markets1 week ago
U.S. Debt Interest Payments Reach $1 Trillion
-

 Business2 weeks ago
Charted: Big Four Market Share by S&P 500 Audits
-

 Real Estate2 weeks ago
Ranked: The Most Valuable Housing Markets in America
-

 Money2 weeks ago
Which States Have the Highest Minimum Wage in America?
-

 AI2 weeks ago
Ranked: Semiconductor Companies by Industry Revenue Share
-

 Markets2 weeks ago
Ranked: The World’s Top Flight Routes, by Revenue
-

 Demographics2 weeks ago
Population Projections: The World’s 6 Largest Countries in 2075
-

 Markets2 weeks ago
The Top 10 States by Real GDP Growth in 2023