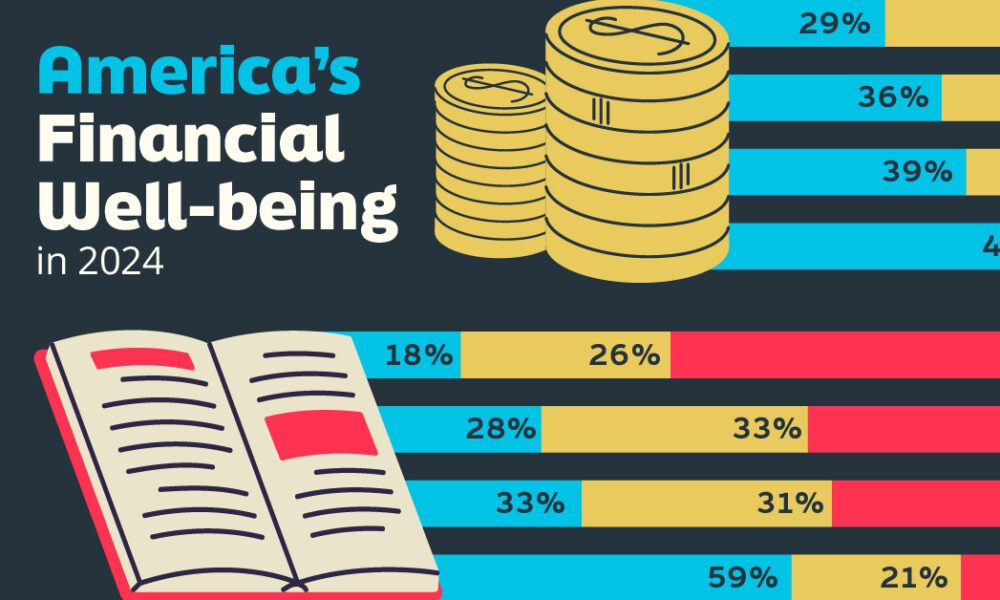
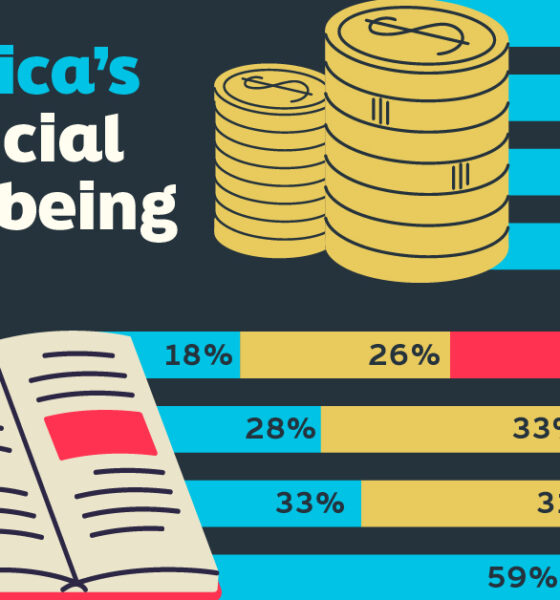
Older, better-educated adults are winning the savings game, reveals a January survey by the National Opinion Research Center at the...


This visualization breaks down how household wealth is distributed around the world. Just 10 countries now account for 75% of total household wealth.
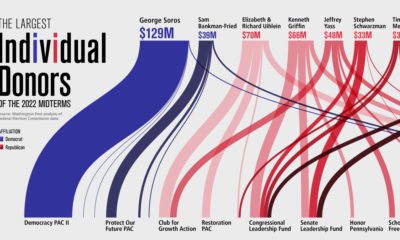

A record-smashing $9 billion has been raised for the 2022 midterm elections. See who the top 10 donors are in this graphic.
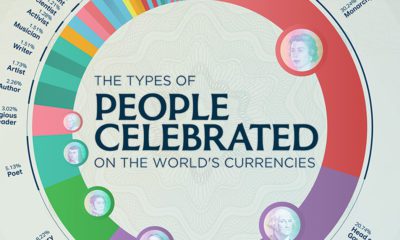

What types of people are celebrated on our money? Here's a look at the various occupations that are featured on international currencies.
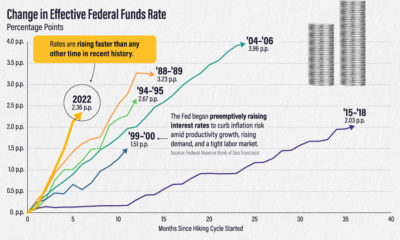

The effective federal funds rate has risen more than two percentage points in six months. How does this compare to other interest rate hikes?
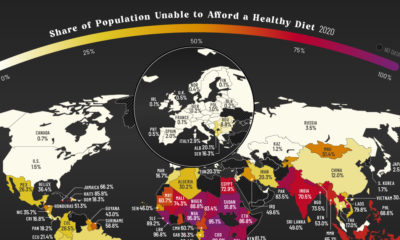

More than three billion people across the globe are unable to afford a healthy diet. See which countries are most affected.
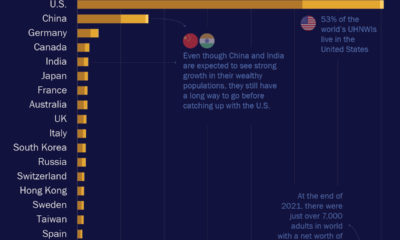

Developing countries are creating wealth like never before, but the majority of the world's ultra-wealthy people still live in the United States.
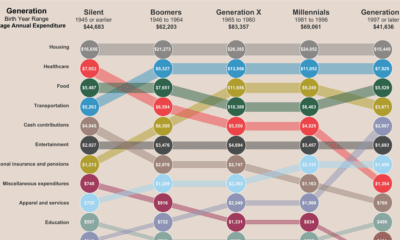

This interactive graphic shows a breakdown of how average Americans spend their money, and how expenses vary across generations.
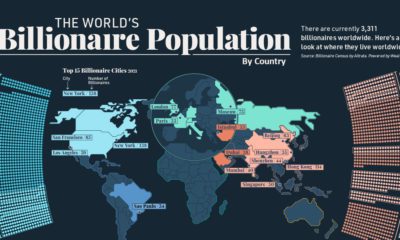

Collectively, worldwide billionaire wealth is nearly $12 trillion. This map breaks down where these 3,311 billionaires live around the globe.


Can money really buy happiness? In this chart, we compare most of the world's countries to examine the relationship between wealth and happiness.
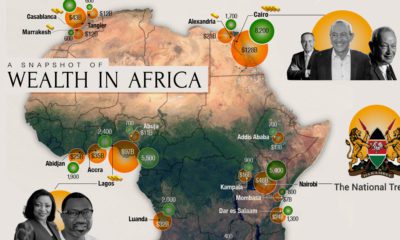

Total private wealth in Africa is now estimated to be US$2.1 trillion. This map looks at where all that wealth is concentrated around the continent.


 Creator Program