

A sneak preview of the exclusive VC+ Special Dispatch—your shortcut to understanding IMF's World Economic Outlook report.
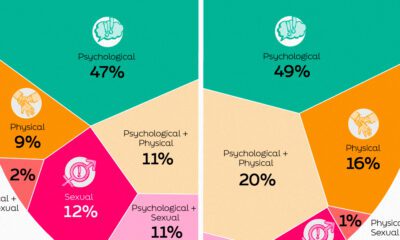

This infographic shows the types of workplace violence and harassment faced by people in the global workplace.
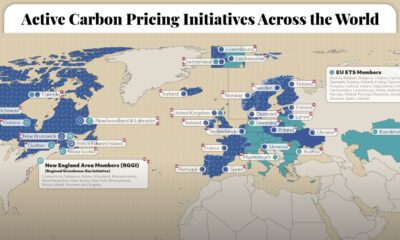

This graphic maps the 70 active carbon pricing initiatives worldwide, their established price of carbon, and the global emissions they cover.
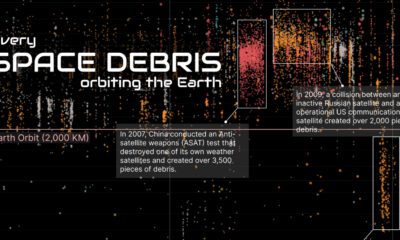

This visual breaks down just how much space debris is currently orbiting the Earth, and the nations responsible for it.
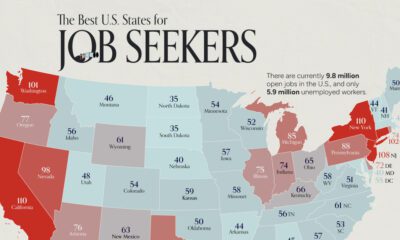

On average, there are 75 workers available for every 100 job openings across the country. Here's how it varies by state.
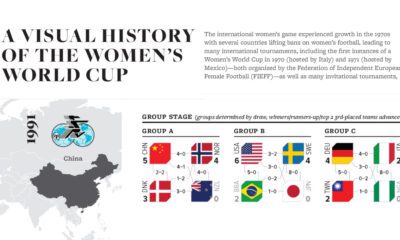

From only 12 teams to 32 teams and record-breaking attendance in 2023: This graphic charts the Women's World Cup's growth since 1991.
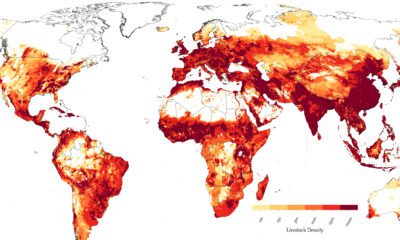

Where are various types of livestock concentrated globally? And how do regional habits influence animal husbandry?
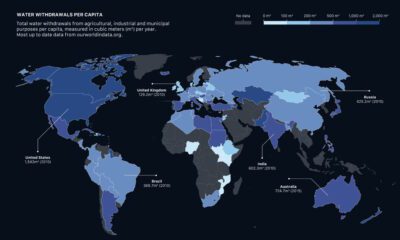

How much water do we have, and which countries use the most? This visual breaks down global water distribution and withdrawals by countries.
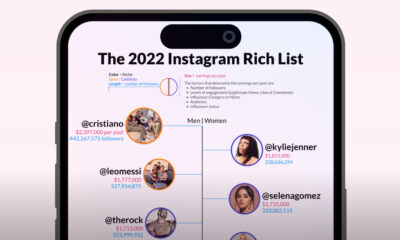

Singers, athletes, actors and Kardashians—here are the most followed Instagram accounts and their estimated earnings per sponsored post.
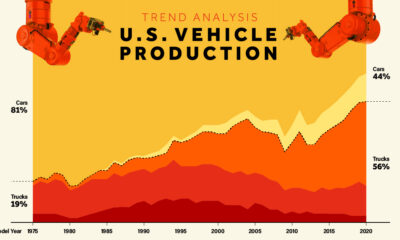

Visualize how U.S. vehicle production has shifted dramatically from cars to trucks, and especially to SUVs, since 1975.
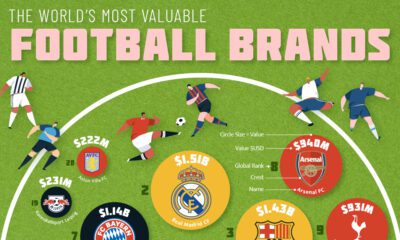

Which clubs, aside from competing on the pitch, also compete as football brands? How much are the most valuable club brands worth?


 Creator Program