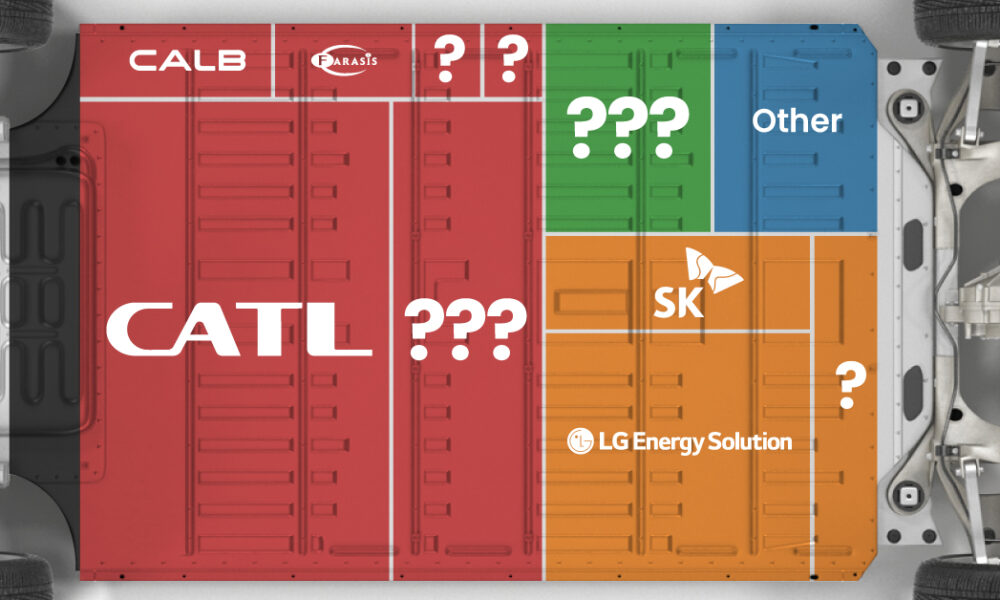
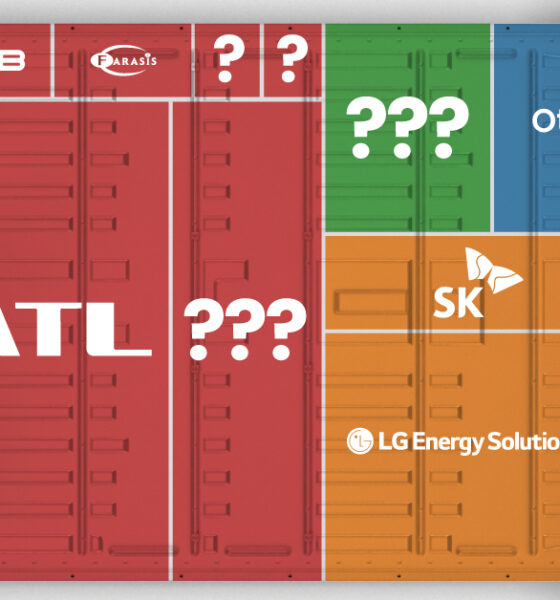
Asia dominates this ranking of the world's largest EV battery manufacturers in 2023.


Uranium production is concentrated in a few countries worldwide. This graphic shows the top producers globally since 1945.


Which companies and sectors generate the most profit per employee? We rank the top 25 companies in the U.S. based on this interesting metric.
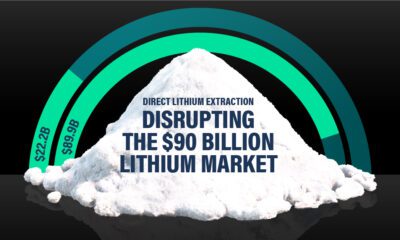

Visual Capitalist and EnergyX explore how direct lithium extraction could disrupt the $90B lithium industry.


Commodity returns in 2023 took a hit. This graphic shows the performance of commodities like gold, oil, nickel, and corn over the last decade.


Global clean energy spending is projected to reach $5.6 trillion by 2030. Which renewable sources are forecast to see the most investment?
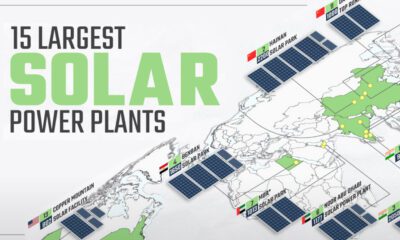

Solar power has grown rapidly over the last decade, and so have solar plants. This map shows the world's 15 largest solar power plants.
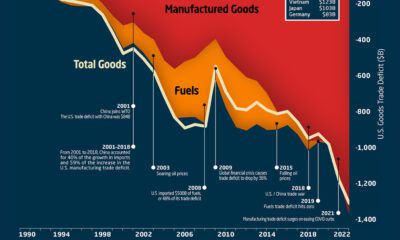

This graphic the U.S. trade deficit growth since 1990, and how manufactured goods and fuels factor in over the last three decades.
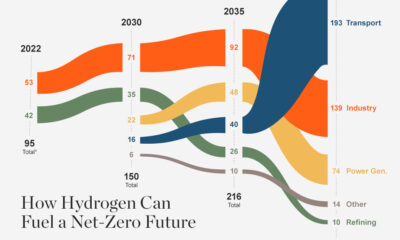

In the race to net zero, demand for hydrogen could increase to 430 Mt p.a. by 2050, but will supply be there when the world needs...
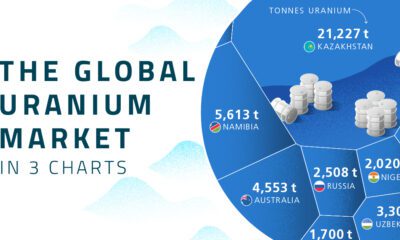

Four countries account for over 70% of global uranium production.
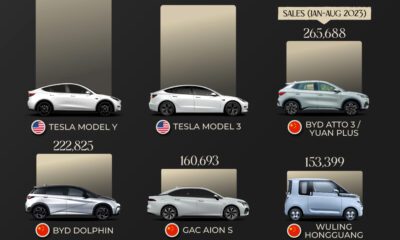

Today, electric vehicle sales make up 18% of global vehicle sales. Here are the leading models by sales as of August 2023.


 Creator Program