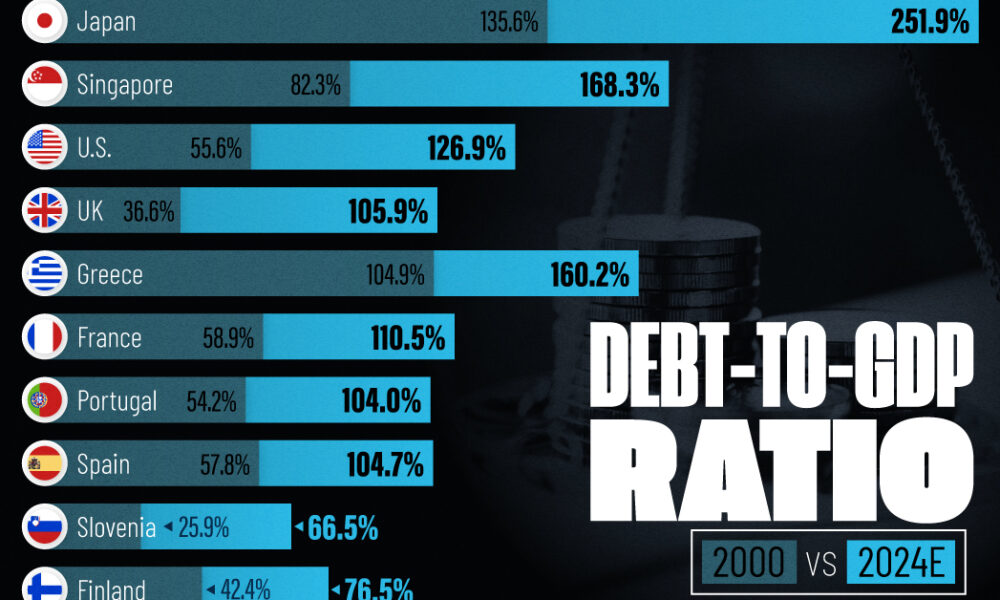
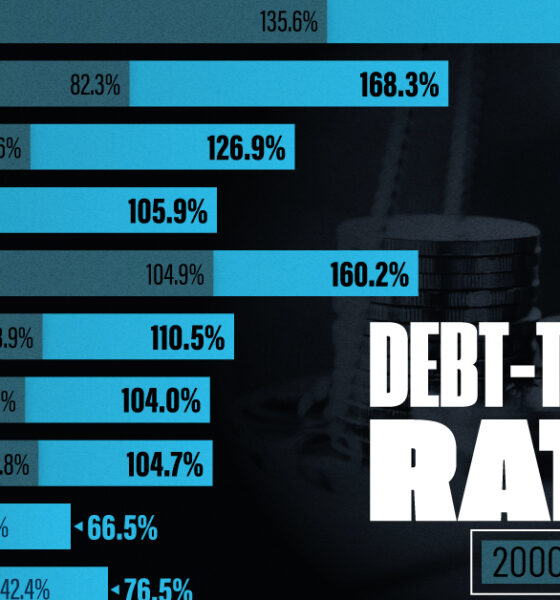
See how much the debt-to-GDP ratios of advanced economies have grown (or shrank) since the year 2000.
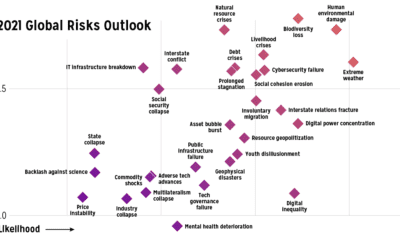

Which risks are top of mind in 2021? We visualize the World Economic Forum's risk assessment for top global risks by impact and livelihood.
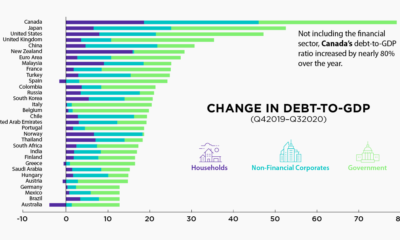

The battle against the COVID-19 pandemic has resulted in heightened debt-to-GDP levels across all sectors and countries.
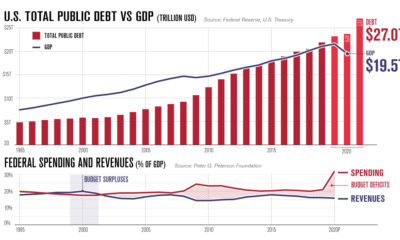

America's debt recently surpassed $27 trillion. In this infographic, we peel back the layers to understand why it keeps on growing.
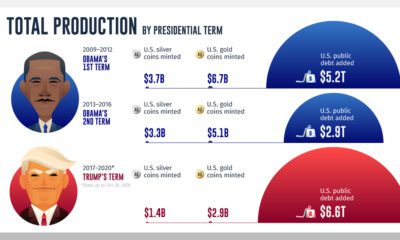

While gold and silver coin production during U.S. presidencies has declined, public debt continues to climb to historically high levels.
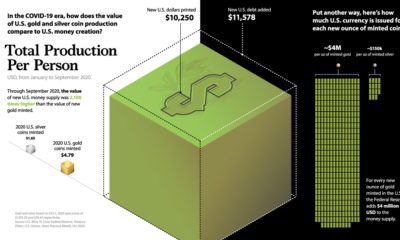

Amid trillions in COVID-19 stimulus, this graphic compares new U.S. dollars printed to U.S. precious metal coin production.
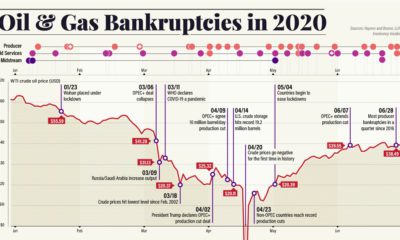

Dropping crude prices and a worsening pandemic have led to a growing wave of energy bankruptcies. Here’s what that fallout looks like.
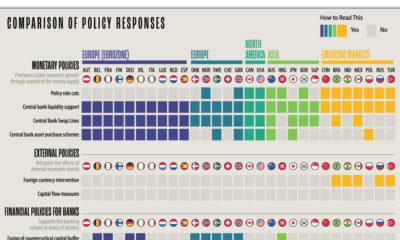

What policy tools are global central banks implementing to combat the economic effects of COVID-19? We compare the responses of 29 countries.
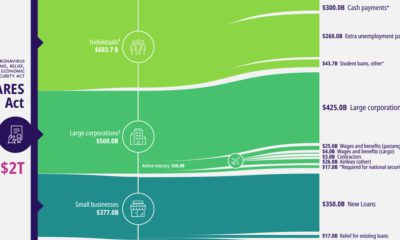

A visual breakdown of the CARES Act, the $2 trillion package to provide COVID-19 economic relief. It's the largest stimulus bill in modern history.
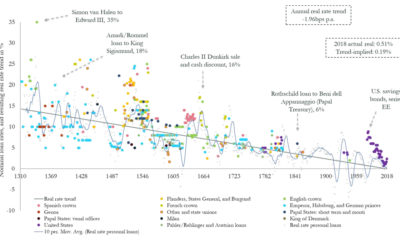

Could interest rates enter negative territory permanently? This chart plots trend data over 700 years, showing that it could be a possibility.
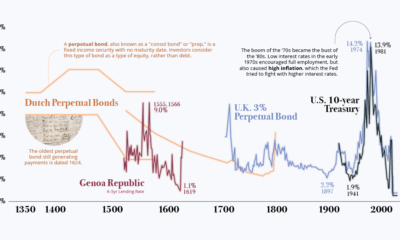

Interest rates sit near generational lows — is this the new normal, or has it been the trend all along? We show a history of interest...


