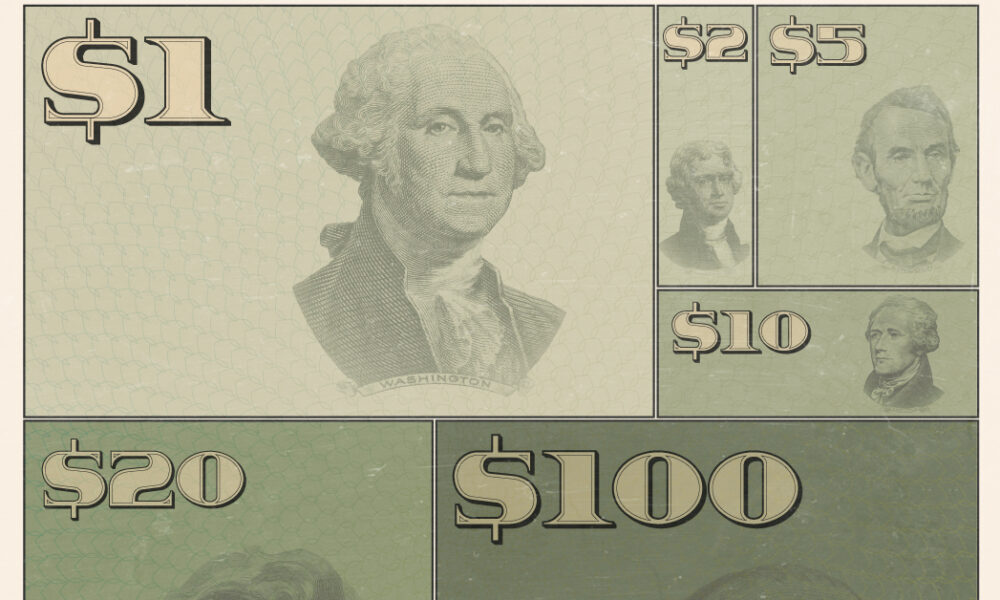
This graphic illustrates the amount of U.S. currency in circulation globally, by denomination, based on data from the Federal Reserve.

The applications of blockchain tech go way beyond just payments. See how smart contracts work in this infographic, and how they may shape entire industries.
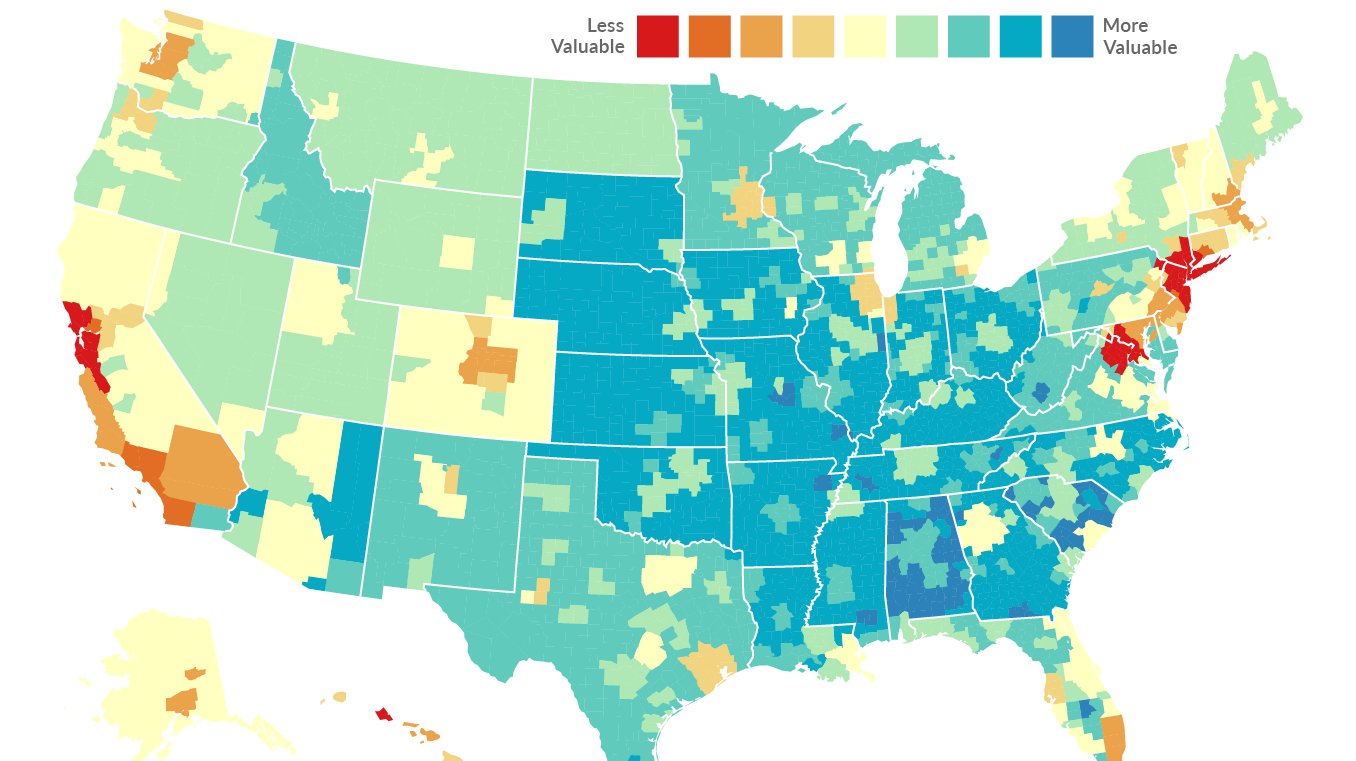
Every dollar spent is not equal. In some cities like NYC or SF, it will buy you far less - and in other places, a dollar...
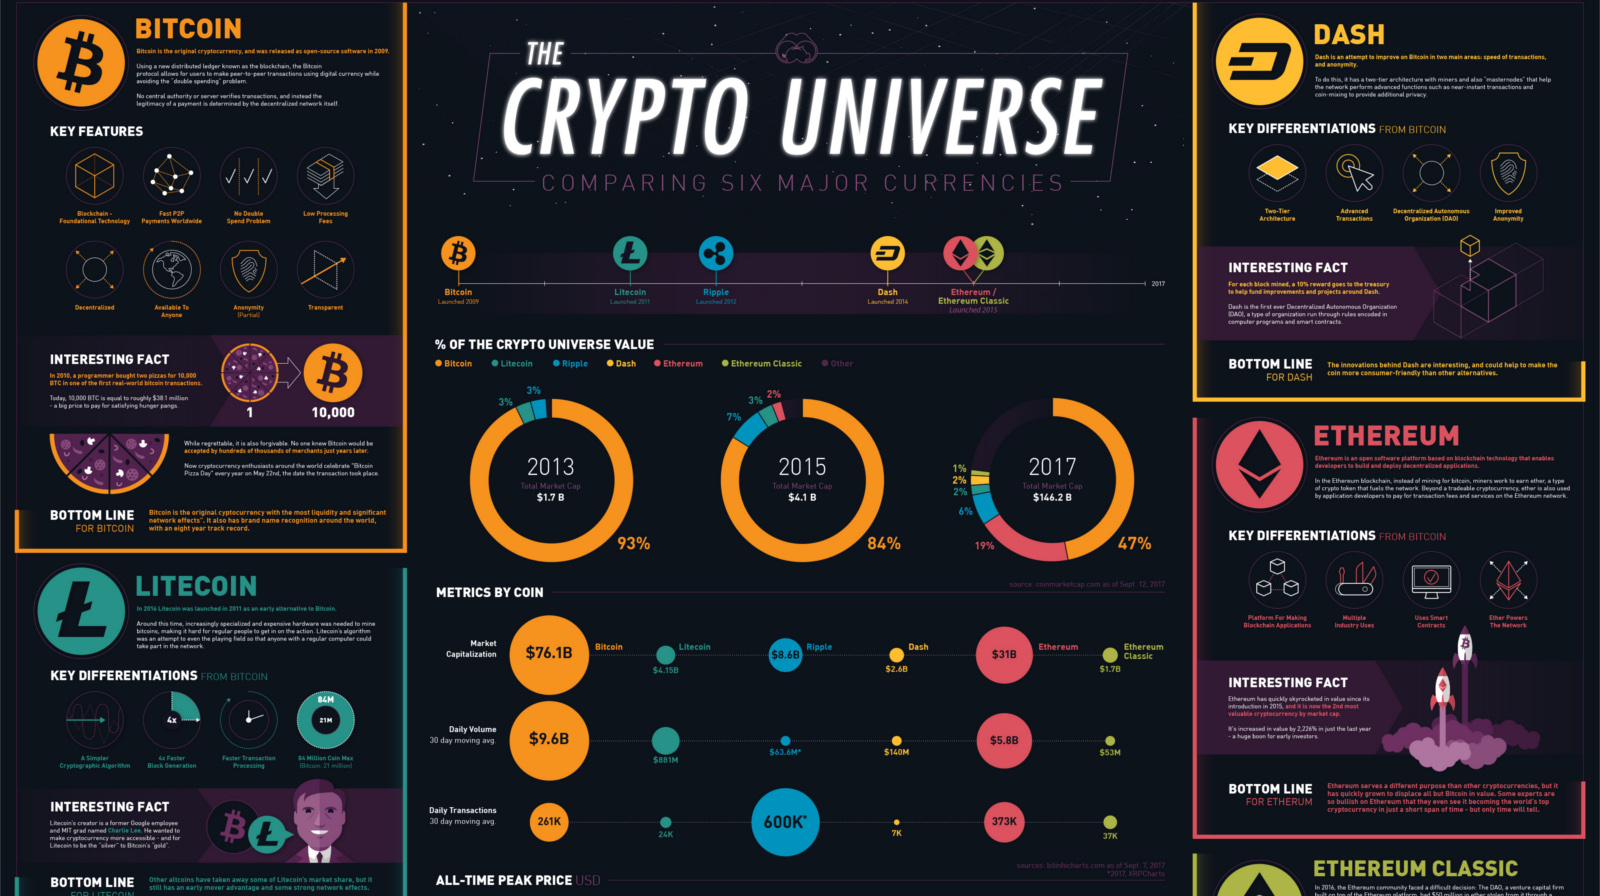
What's the difference between Bitcoin, Ethereum, Dash, Ripple, and Litecoin? This infographic breaks it all down, as well as many other key metrics.

Markets are complex systems - and there is mounting evidence that they have reached a critical state. See how and why the next 'avalanche' could be...
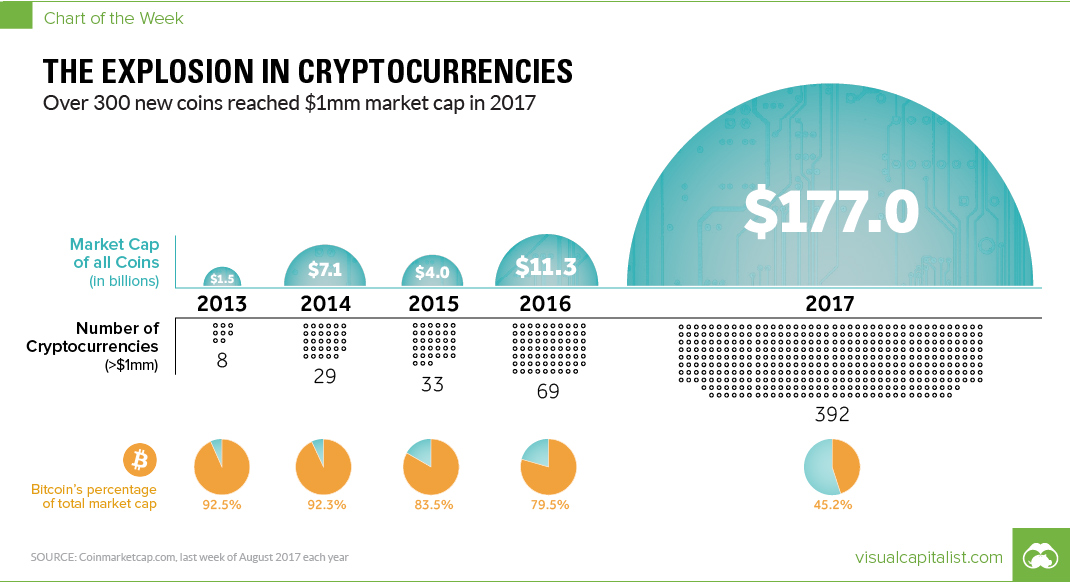
In 12 months, the number of cryptocurrencies worth >$1mm has soared by 468%. Meanwhile, the total value of all currencies together has skyrocketed by 1,466%.
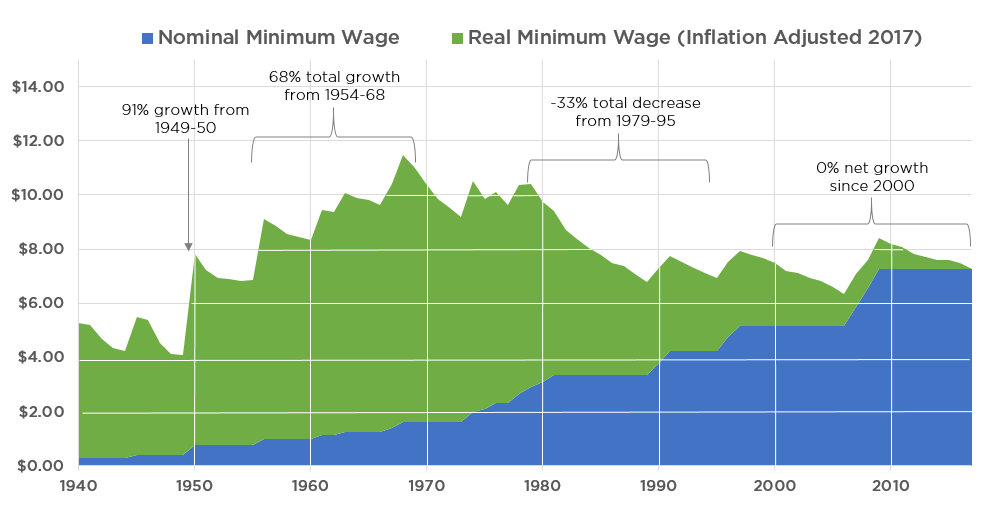
In real terms, the U.S. minimum wage peaked in value in 1968 - and it has actually dropped by more than 30% since then.
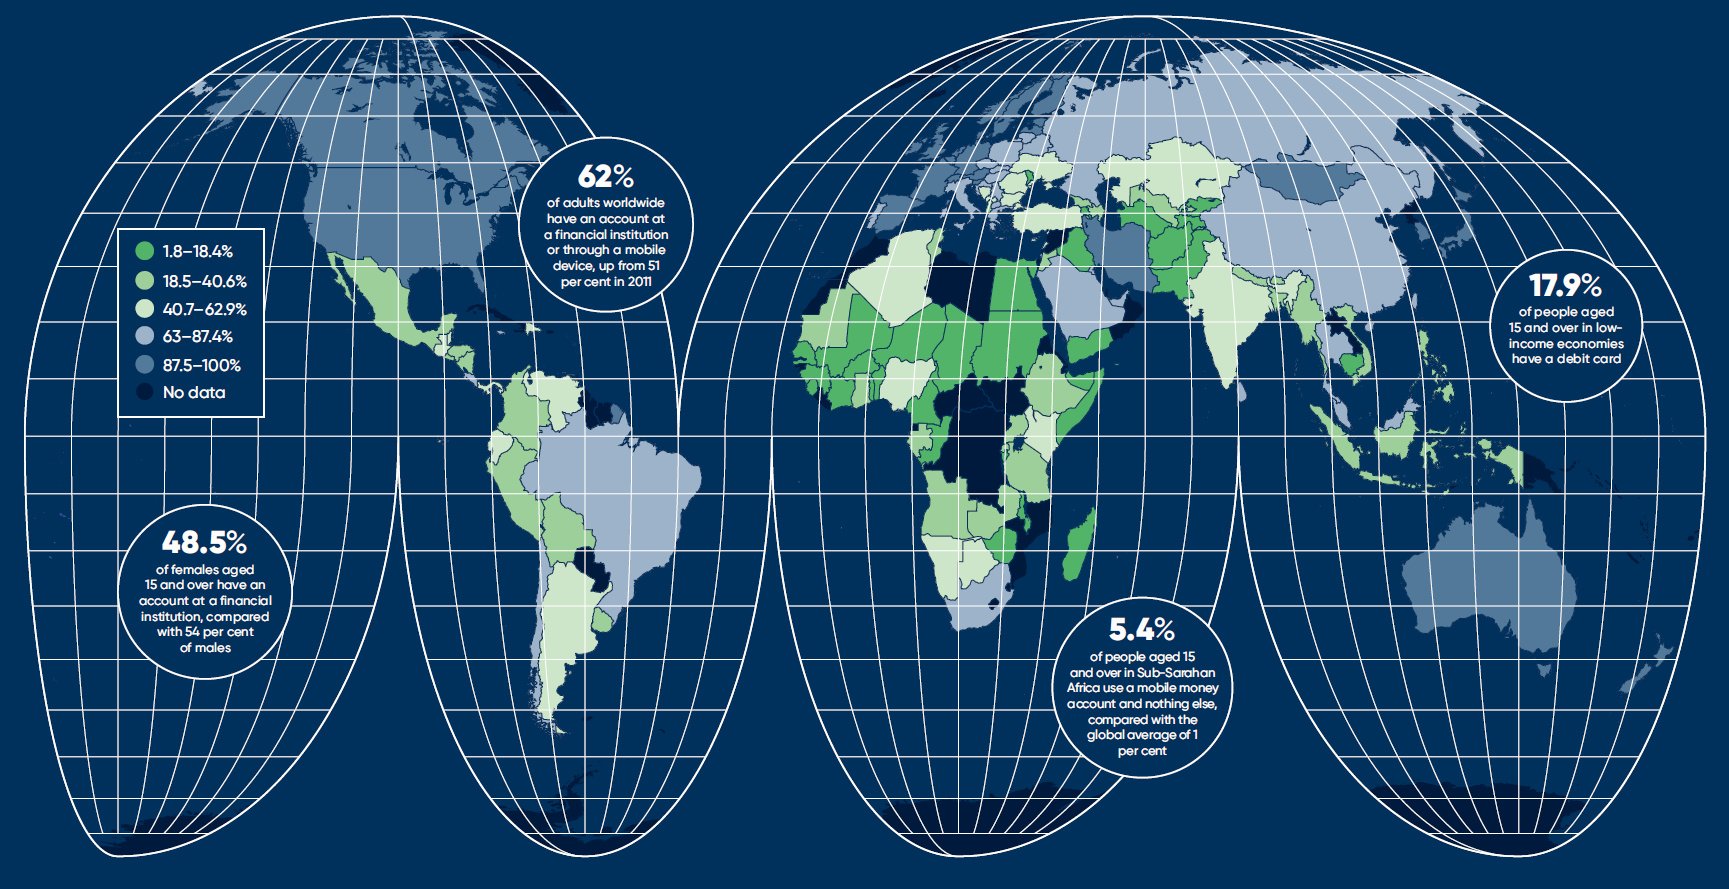
We take financial services for granted - but there are billions of people globally without them. This presents a unique opportunity to bank the 'unbanked'.
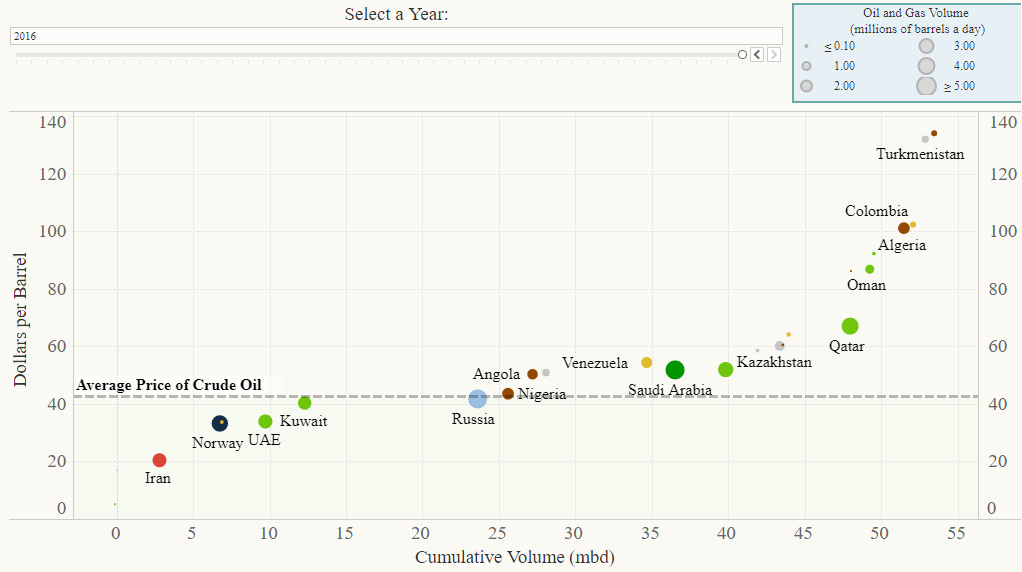
This interactive chart shows the breakeven prices that oil-rich countries need to pay for imports. We also dive into Venezuela's specific crisis as well.
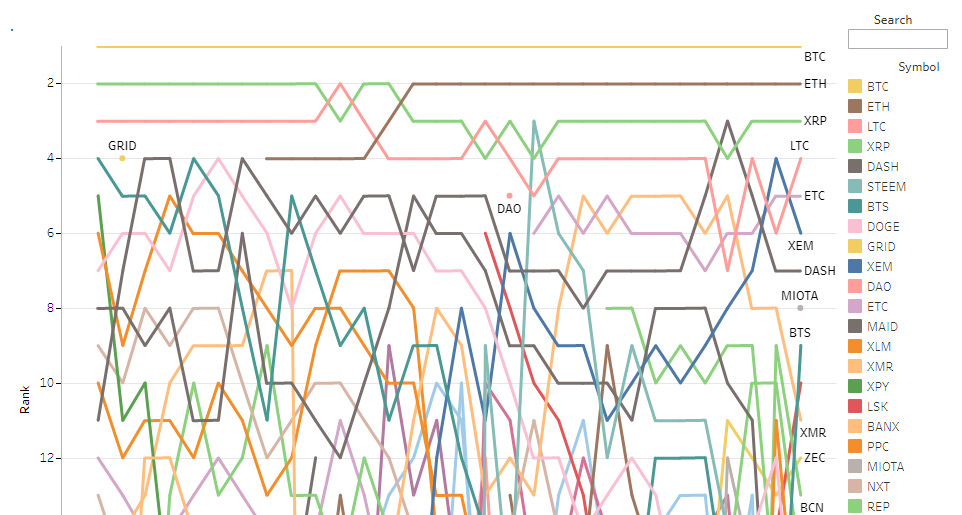
The coin universe is fast-moving and sometimes chaotic. See how the list of the top 20 cryptocurrencies has changed over the last 2.5 years.
How much currency is printed each year? How long do bills last? Learn 38 facts on the modern U.S. dollar in this infographic.


