Markets
Visualizing the Buying Power of the U.S. Dollar Over the Last Century
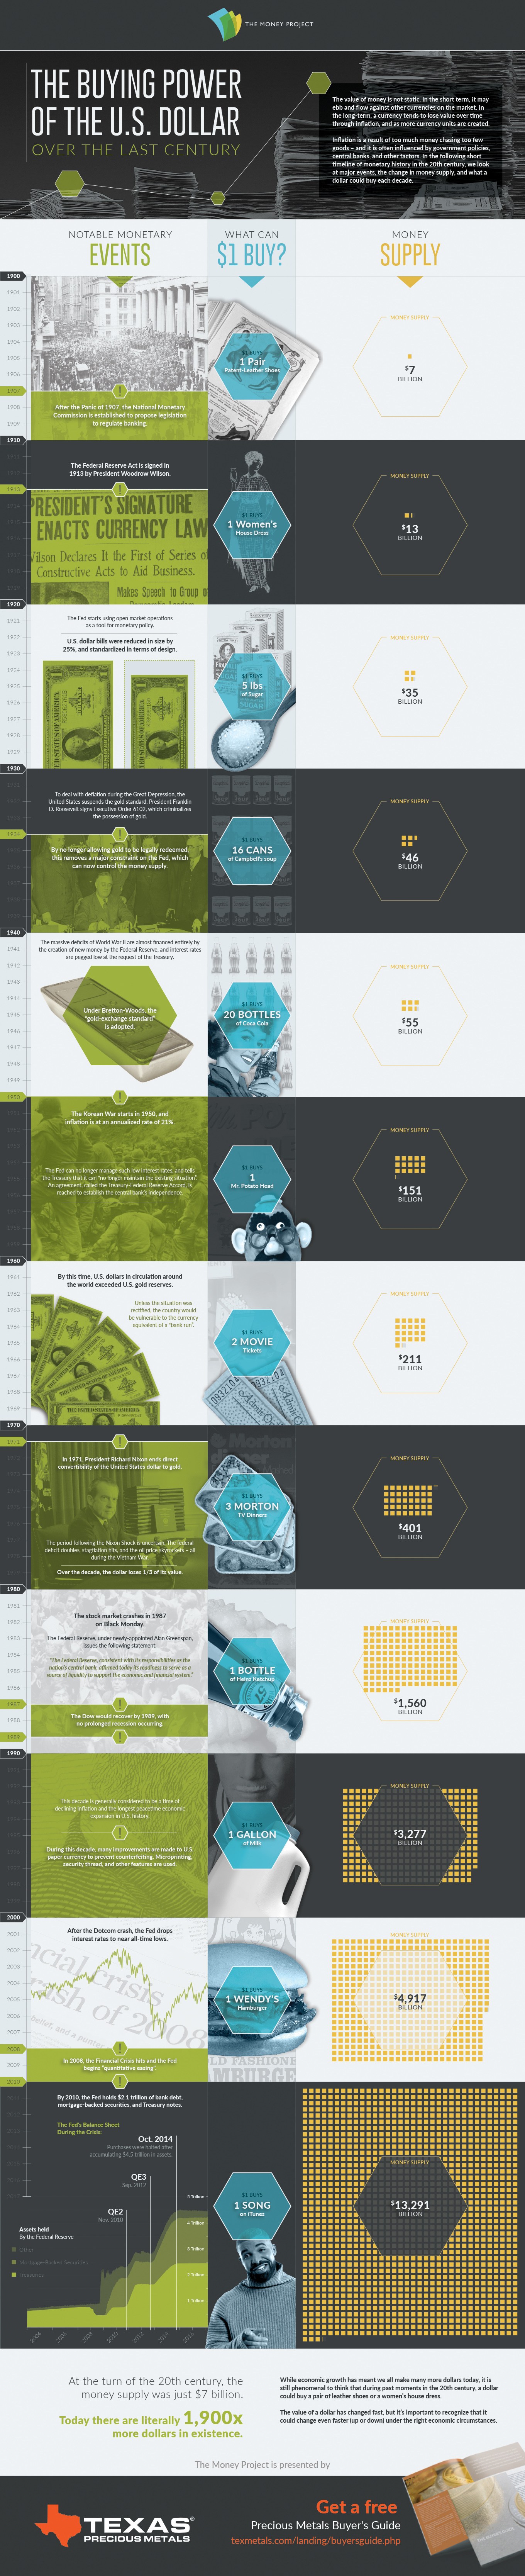
The Buying Power of the U.S. Dollar Over the Last Century
The Money Project is an ongoing collaboration between Visual Capitalist and Texas Precious Metals that seeks to use intuitive visualizations to explore the origins, nature, and use of money.
The value of money is not static. In the short term, it may ebb and flow against other currencies on the market. In the long-term, a currency tends to lose buying power over time through inflation, and as more currency units are created.
Inflation is a result of too much money chasing too few goods – and it is often influenced by government policies, central banks, and other factors. In this short timeline of monetary history in the 20th century, we look at major events, the change in money supply, and the buying power of the U.S. dollar in each decade.
A Short Timeline of U.S. Monetary History
1900s
After the Panic of 1907, the National Monetary Commission is established to propose legislation to regulate banking.
U.S. Money Supply: $7 billion
What $1 Could Buy: A pair of patent leather shoes.
1910s
The Federal Reserve Act is signed in 1913 by President Woodrow Wilson.
U.S. Money Supply: $13 billion
What $1 Could Buy: A woman’s house dress.
1920s
U.S. dollar bills were reduced in size by 25%, and standardized in terms of design.
The Fed starts using open market operations as a tool for monetary policy.
U.S. Money Supply: $35 billion
What $1 Could Buy: Five pounds of sugar.
1930s
To deal with deflation during the Great Depression, the United States suspends the gold standard. President Franklin D. Roosevelt signs Executive Order 6102, which criminalizes the possession of gold.
By no longer allowing gold to be legally redeemed, this removes a major constraint on the Fed, which can now control the money supply.
U.S. Money Supply: $46 billion
What $1 Could Buy: 16 cans of Campbell’s Soup
1940s
The massive deficits of World War II are almost financed entirely by the creation of new money by the Federal Reserve.
Interest rates are pegged low at the request of the Treasury.
Under Bretton-Woods, the “gold-exchange standard” is adopted.
U.S. Money Supply: $55 billion
What $1 Could Buy: 20 bottles of Coca-Cola
1950s
The Korean War starts in 1950, and inflation is at an annualized rate of 21%.
The Fed can no longer manage such low interest rates, and tells the Treasury that it can “no longer maintain the existing situation”.
U.S. Money Supply: $151 billion
What $1 Could Buy: One Mr. Potato Head
1960s
An agreement, called the Treasury-Federal Reserve Accord, is reached to establish the central bank’s independence.
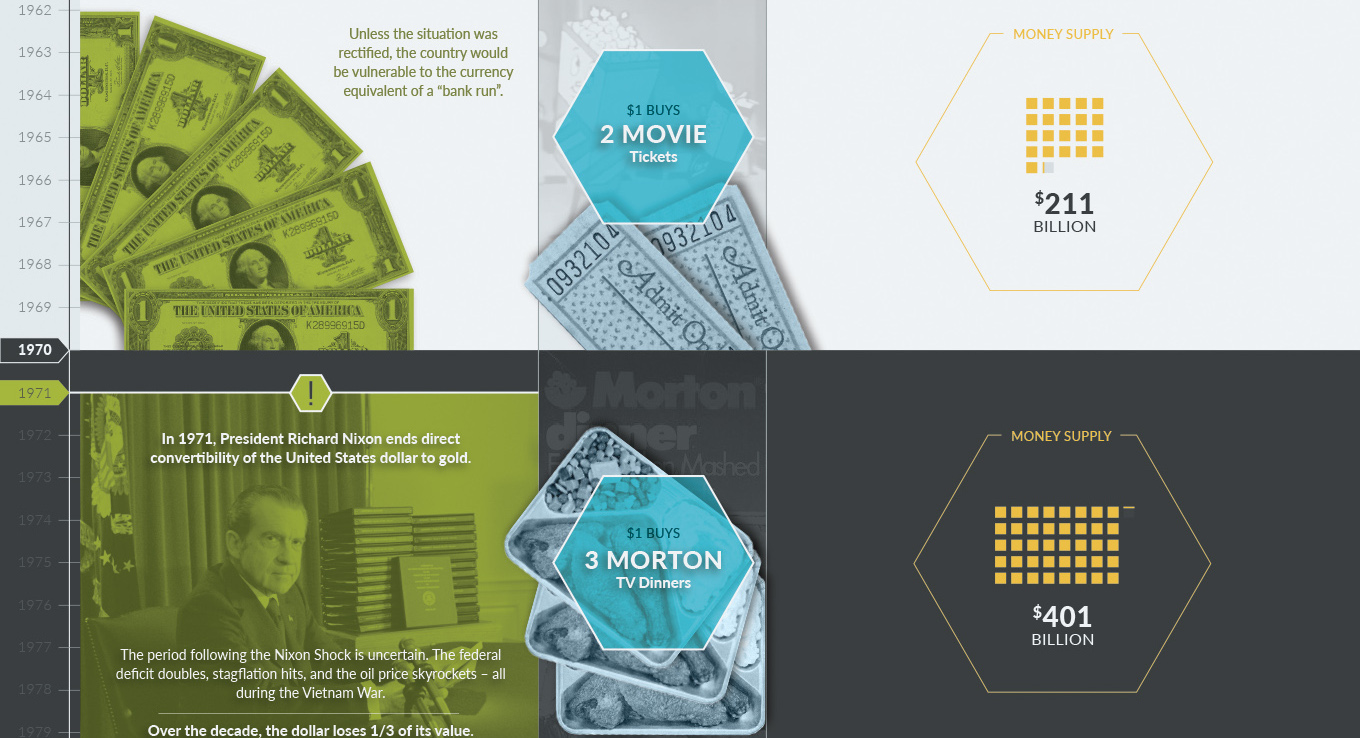
By this time, U.S. dollars in circulation around the world exceeded U.S. gold reserves. Unless the situation was rectified, the country would be vulnerable to the currency equivalent of a “bank run”.
U.S. Money Supply: $211 billion
What $1 Could Buy: Two movie tickets.
1970s
In 1971, President Richard Nixon ends direct convertibility of the United States dollar to gold.
The period following the Nixon Shock is uncertain. The federal deficit doubles, stagflation hits, and the oil price skyrockets – all during the Vietnam War.
Over the decade, the dollar loses 1/3 of its value.
U.S. Money Supply: $401 billion
What $1 Could Buy: Three Morton TV dinners.
1980s
The stock market crashes in 1987 on Black Monday.
The Federal Reserve, under newly-appointed Alan Greenspan, issues the following statement:
“The Federal Reserve, consistent with its responsibilities as the nation’s central bank, affirmed today its readiness to serve as a source of liquidity to support the economic and financial system.”
The Dow would recover by 1989, with no prolonged recession occurring.
U.S. Money Supply: $1,560 billion
What $1 Could Buy: One bottle of Heinz Ketchup.
1990s
This decade is generally considered to be a time of declining inflation and the longest peacetime economic expansion in U.S. history.
During this decade, many improvements are made to U.S. paper currency to prevent counterfeiting. Microprinting, security thread, and other features are used.
U.S. Money Supply: $3,277 billion
What $1 Could Buy: One gallon of milk.
2000s
After the Dotcom crash, the Fed drops interest rates to near all-time lows.
In 2008, the Financial Crisis hits and the Fed begins “quantitative easing”. Later, this would be known as QE1.
U.S. Money Supply: $4,917 billion
What $1 Could Buy: One Wendy’s hamburger.
2010-
After QE1, the Fed holds $2.1 trillion of bank debt, mortgage-backed securities, and Treasury notes. Shortly after, QE2 starts.
In 2012, it’s time for QE3.
Purchases were halted in October 2014 after accumulating $4.5 trillion in assets.
U.S. Money Supply: $13,291 billion
What $1 Could Buy: One song from iTunes.
The Changing Value of a Dollar
At the turn of the 20th century, the money supply was just $7 billion. Today there are literally 1,900X more dollars in existence.
While economic growth has meant we all make many more dollars today, it is still phenomenal to think that during past moments in the 20th century, a dollar could buy a pair of leather shoes or a women’s house dress.
The buying power of a dollar has changed significantly over the last century, but it’s important to recognize that it could change even faster (up or down) under the right economic circumstances.
About The Money Project
The Money Project is an ongoing collaboration between Visual Capitalist and Texas Precious Metals that seeks to use intuitive visualizations to explore the origins, nature, and use of money.


Economy
Economic Growth Forecasts for G7 and BRICS Countries in 2024
The IMF has released its economic growth forecasts for 2024. How do the G7 and BRICS countries compare?


G7 & BRICS Real GDP Growth Forecasts for 2024
The International Monetary Fund’s (IMF) has released its real gross domestic product (GDP) growth forecasts for 2024, and while global growth is projected to stay steady at 3.2%, various major nations are seeing declining forecasts.
This chart visualizes the 2024 real GDP growth forecasts using data from the IMF’s 2024 World Economic Outlook for G7 and BRICS member nations along with Saudi Arabia, which is still considering an invitation to join the bloc.
Get the Key Insights of the IMF’s World Economic Outlook
Want a visual breakdown of the insights from the IMF’s 2024 World Economic Outlook report?
This visual is part of a special dispatch of the key takeaways exclusively for VC+ members.
Get the full dispatch of charts by signing up to VC+.
Mixed Economic Growth Prospects for Major Nations in 2024
Economic growth projections by the IMF for major nations are mixed, with the majority of G7 and BRICS countries forecasted to have slower growth in 2024 compared to 2023.
Only three BRICS-invited or member countries, Saudi Arabia, the UAE, and South Africa, have higher projected real GDP growth rates in 2024 than last year.
| Group | Country | Real GDP Growth (2023) | Real GDP Growth (2024P) |
|---|---|---|---|
| G7 | 🇺🇸 U.S. | 2.5% | 2.7% |
| G7 | 🇨🇦 Canada | 1.1% | 1.2% |
| G7 | 🇯🇵 Japan | 1.9% | 0.9% |
| G7 | 🇫🇷 France | 0.9% | 0.7% |
| G7 | 🇮🇹 Italy | 0.9% | 0.7% |
| G7 | 🇬🇧 UK | 0.1% | 0.5% |
| G7 | 🇩🇪 Germany | -0.3% | 0.2% |
| BRICS | 🇮🇳 India | 7.8% | 6.8% |
| BRICS | 🇨🇳 China | 5.2% | 4.6% |
| BRICS | 🇦🇪 UAE | 3.4% | 3.5% |
| BRICS | 🇮🇷 Iran | 4.7% | 3.3% |
| BRICS | 🇷🇺 Russia | 3.6% | 3.2% |
| BRICS | 🇪🇬 Egypt | 3.8% | 3.0% |
| BRICS-invited | 🇸🇦 Saudi Arabia | -0.8% | 2.6% |
| BRICS | 🇧🇷 Brazil | 2.9% | 2.2% |
| BRICS | 🇿🇦 South Africa | 0.6% | 0.9% |
| BRICS | 🇪🇹 Ethiopia | 7.2% | 6.2% |
| 🌍 World | 3.2% | 3.2% |
China and India are forecasted to maintain relatively high growth rates in 2024 at 4.6% and 6.8% respectively, but compared to the previous year, China is growing 0.6 percentage points slower while India is an entire percentage point slower.
On the other hand, four G7 nations are set to grow faster than last year, which includes Germany making its comeback from its negative real GDP growth of -0.3% in 2023.
Faster Growth for BRICS than G7 Nations
Despite mostly lower growth forecasts in 2024 compared to 2023, BRICS nations still have a significantly higher average growth forecast at 3.6% compared to the G7 average of 1%.
While the G7 countries’ combined GDP is around $15 trillion greater than the BRICS nations, with continued higher growth rates and the potential to add more members, BRICS looks likely to overtake the G7 in economic size within two decades.
BRICS Expansion Stutters Before October 2024 Summit
BRICS’ recent expansion has stuttered slightly, as Argentina’s newly-elected president Javier Milei declined its invitation and Saudi Arabia clarified that the country is still considering its invitation and has not joined BRICS yet.
Even with these initial growing pains, South Africa’s Foreign Minister Naledi Pandor told reporters in February that 34 different countries have submitted applications to join the growing BRICS bloc.
Any changes to the group are likely to be announced leading up to or at the 2024 BRICS summit which takes place October 22-24 in Kazan, Russia.
Get the Full Analysis of the IMF’s Outlook on VC+
This visual is part of an exclusive special dispatch for VC+ members which breaks down the key takeaways from the IMF’s 2024 World Economic Outlook.
For the full set of charts and analysis, sign up for VC+.

-

 Markets1 week ago
U.S. Debt Interest Payments Reach $1 Trillion
-

 Business2 weeks ago
Charted: Big Four Market Share by S&P 500 Audits
-

 Markets2 weeks ago
Ranked: The Most Valuable Housing Markets in America
-

 Money2 weeks ago
Which States Have the Highest Minimum Wage in America?
-

 AI2 weeks ago
Ranked: Semiconductor Companies by Industry Revenue Share
-

 Markets2 weeks ago
Ranked: The World’s Top Flight Routes, by Revenue
-

 Countries2 weeks ago
Population Projections: The World’s 6 Largest Countries in 2075
-

 Markets2 weeks ago
The Top 10 States by Real GDP Growth in 2023