

The country with the most forest loss since 2001 lost as much forest cover as the next four countries combined.
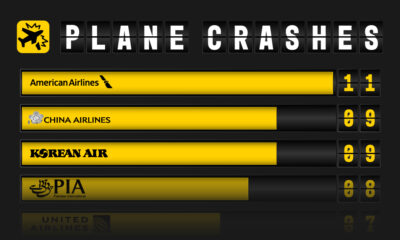

Considering there are tens of millions of flights per year, major plane crashes are actually extremely rare.


This graphic breaks down Microsoft's revenue by segment—from cloud office software to AI search engine capabilities in 2023.


This infographic lists the top energy priorities in 28 countries, based on an Ipsos survey involving 24,000 people.
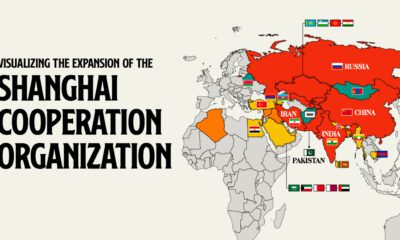

Established by China, Russia, and former Soviet states, the SCO serves as a counterbalance to Western influence in Eurasia.
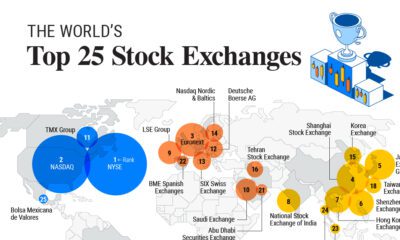

Here are the top 25 largest stock exchanges in the world, worth a combined $106 trillion in market capitalization in 2023.


In this graphic, we take a look at the recent U.S. mortgage rate surge, and how the 30-year fixed-rate mortgage has evolved since 2013.
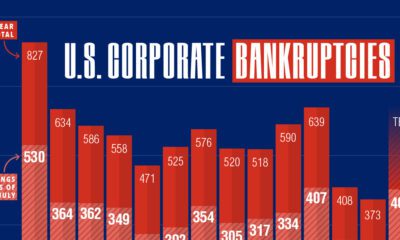

In 2023, over 400 companies have folded. This graphic shows how corporate bankruptcies are growing at the second-fastest rate since 2010.
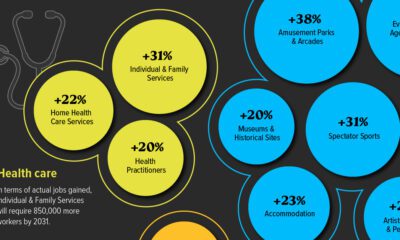

Key sectors in the U.S.—including Leisure and Health Social Services—are projected to be the fastest growing industries over the next decade.


From Patagonia to TikTok, which brands are highly regarded in the eyes of Americans? This visual ranks the brand reputations of 100 companies.
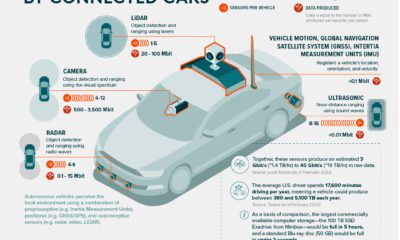

By 2025, connected cars could produce 10 exabytes (exabyte = 1B gigabytes) of data per month, a thousand-fold increase over current volumes.
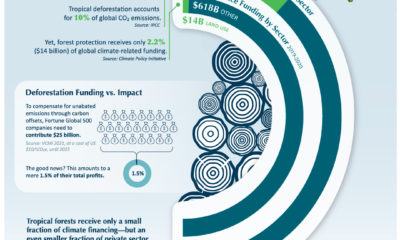

Deforestation accounts for 10% of global CO2 emissions, yet receives just a small slice of climate funding. See why closing this funding gap is necessary to...
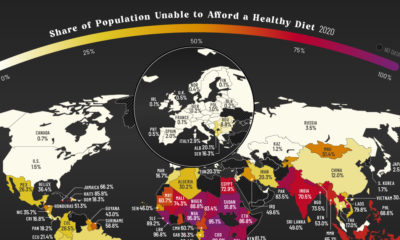

More than three billion people across the globe are unable to afford a healthy diet. See which countries are most affected.


Which countries dominate outer space? This visual displays the number of objects every country has launched into space over time.
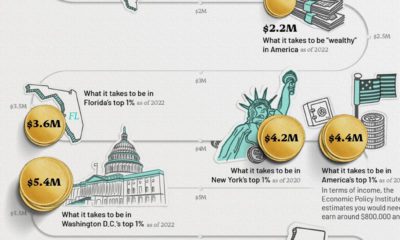

This infographic visualizes several net worth milestones to give you a better idea of where you stand today.
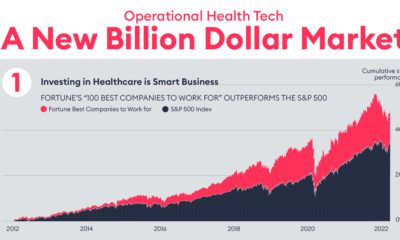

Operational health tech is poised to be a multi-billion dollar industry. This graphic breaks down how its disrupting healthcare as we know it.


This infographic analyzes over 30 years of stock market performance to identify the best and worst months for gains.
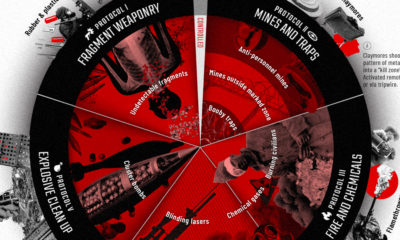

This infographic covers the various types of weapons that are restricted or prohibited in war, according to international humanitarian laws.
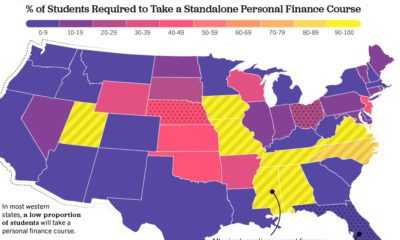

Only 22.7% of U.S. students are required to take a personal finance course. Which states have the highest levels of personal finance education?
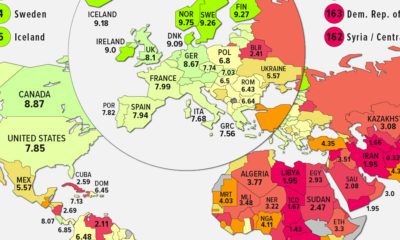

We map the state of global democracy, as the Democracy Index hits its lowest point since the inception of the index in 2006.
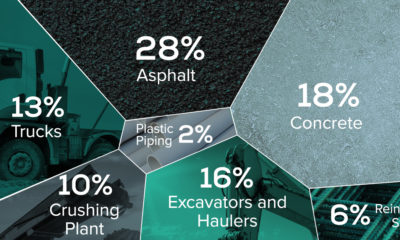

The U.S. alone generates ∼12 million tons of asphalt shingles tear-off waste and installation scrap every year and more than 90% of it is dumped into...
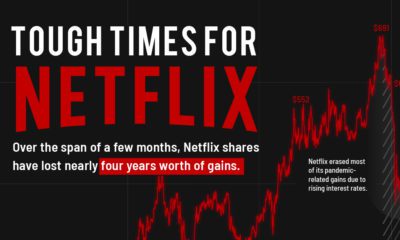

Disappointing results have pushed Netflix shares down by over 60% year-to-date. This infographic puts the company's rocky year into perspective.
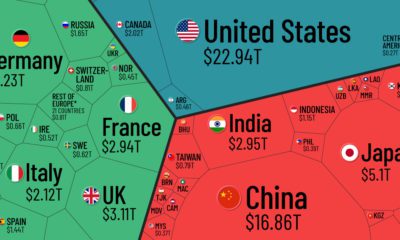

Which countries and regions contribute the most to the world economy? In this infographic, we break down all $94 trillion of global GDP by country.


