Technology
By the Numbers: Are Tech IPOs Worth the Hype?


Tech IPOs — Hype vs. Reality
Initial Public Offerings (IPOs) generate massive amounts of attention from investors and media alike, especially for new and fast-rising companies in the technology sector.
On the surface, the attention is warranted. Some of the most well-known tech companies have built their profile by going public, including Facebook by raising $16 billion in 2012.
But when you peel away the hype and examine investor returns from tech IPOs more closely, the reality can leave a lot to be desired.
The Hype in Numbers
When it comes to the IPOs of companies beginning to sell shares on public stock exchanges, tech offerings have become synonymous with billion-dollar launches.
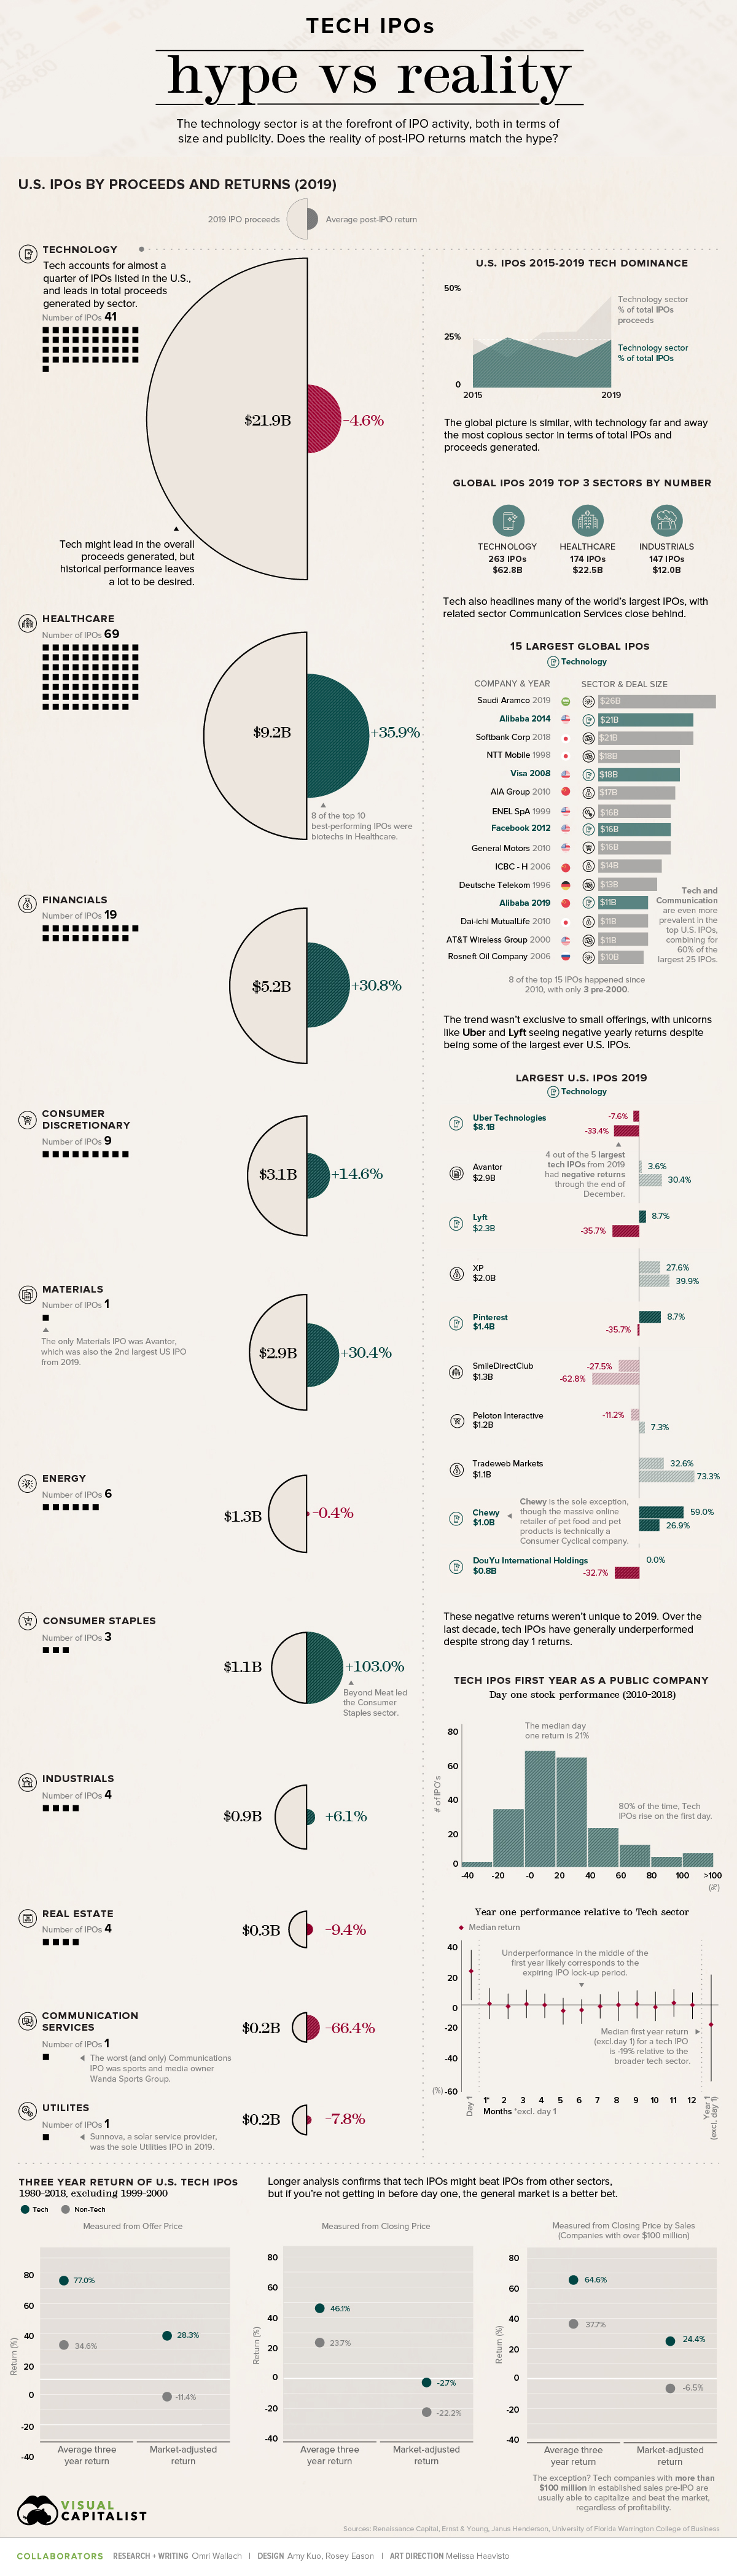
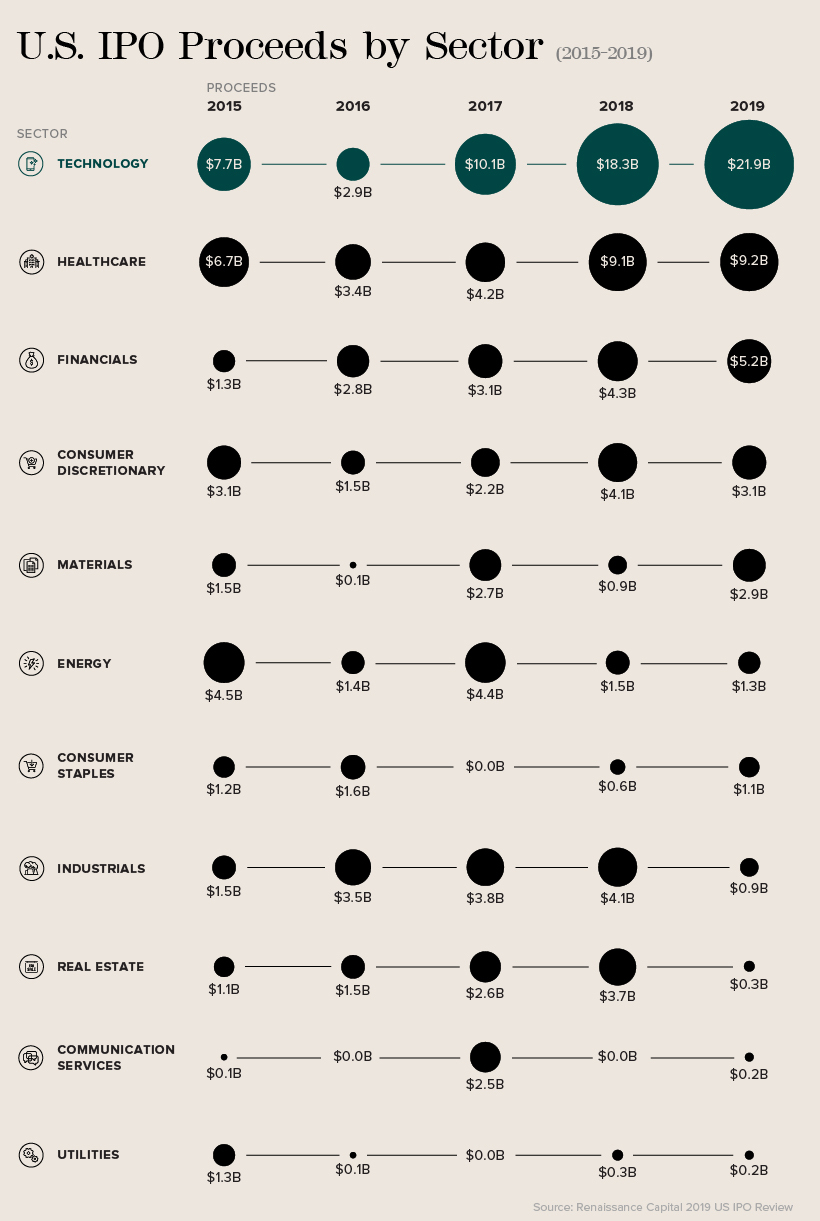
Given the sheer magnitude of IPOs based in the technology sector, it’s easy to understand why. Globally, the technology sector has regularly generated the most IPOs and highest proceeds, as shown in a recent report by Ernst & Young.
In 2019 alone, the world’s public markets saw 263 IPOs in the tech sector with total proceeds of $62.8 billion. That’s far ahead of the second-place healthcare sector, which saw 174 IPOs generate proceeds of $22.5 billion.
The discrepancy is more apparent in the U.S., according to data from Renaissance Capital. In fact, over the last five years, the tech sector has accounted for 23% of total U.S. IPOs and 34% of proceeds generated by U.S. IPOs.
The prevalence of tech is even more apparent when examining history’s largest IPOs. Of the 25 largest IPOs in U.S. history, 60% come from the technology and communication services sectors.
That list includes last year’s well-publicized IPOs for Uber ($8.1 billion) and Lyft ($2.3 billion), as well as a direct public offering from Slack ($7.4 billion). Soon the list might include Airbnb, which plans to list within the communication services sector instead of tech.
The Reality in Returns
But the proof, as they say, is in the pudding.
Uber and Lyft were two of 2019’s largest U.S. IPOs, but they also saw some of the poorest returns. Uber fell 33.4% from its IPO price at year end, while Lyft was down 35.7%.
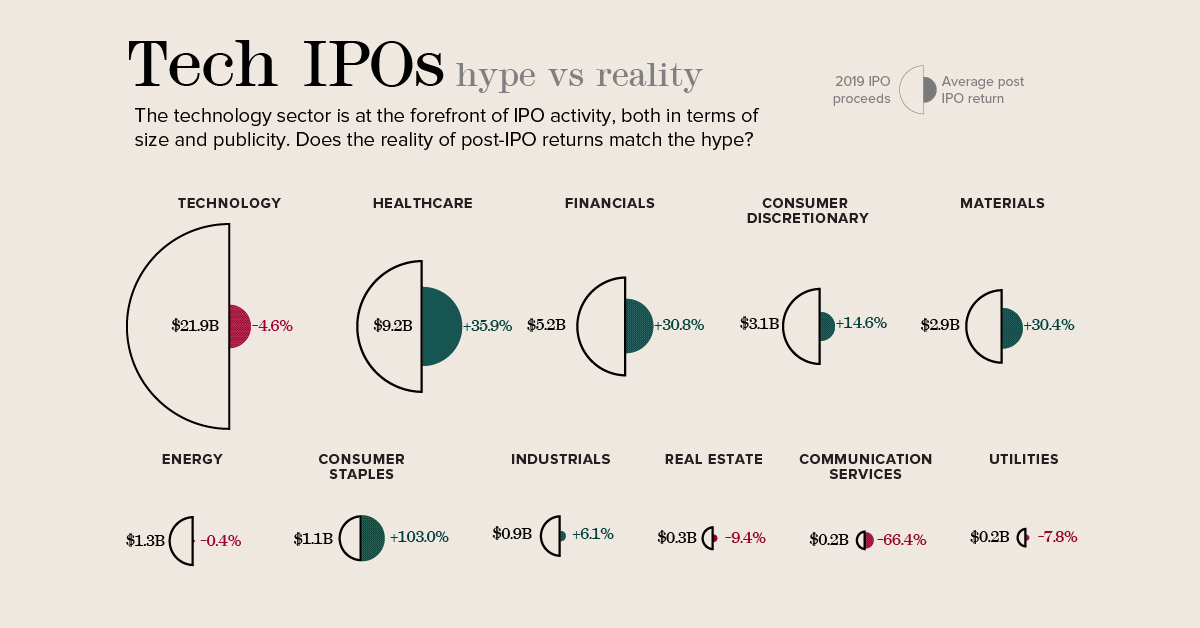
And they were far from isolated incidents. Tech IPOs averaged a return of -4.6% last year, far behind the top sectors of consumer staples (led by Beyond Meat) and healthcare.
| Sector | Avg. IPO Return (2019) |
|---|---|
| Consumer Staples | 103.0% |
| Healthcare | 35.9% |
| Financials | 30.8% |
| Materials | 30.4% |
| Consumer Discretionary | 14.6% |
| Industrials | 6.1% |
| Energy | -0.4% |
| Technology | -4.6% |
| Utilities | -7.8% |
| Real Estate | -9.4% |
| Communication Services | -66.4% |
While last year was the first time tech IPOs have averaged a negative return in four years, analysis of the last 10 years confirms that tech IPOs have underperformed over the last decade.
A decade-long analysis from investment firm Janus Henderson demonstrated that U.S. tech IPOs start underperforming compared to the broad tech sector about 5-6 months after launching.
This dip likely corresponds to the expiry of an IPO’s lock-up period—the time that a company’s pre-IPO investors are able to sell their stock. By cashing in on strong early performance, investors flood the market and bring share prices down.
Interestingly, most gains for these IPOs tend to happen within the first day of trading. The median first-day performance for tech IPOs was a 21% increase over the offer price. That’s why the median first-year return for a tech IPO, excluding the first day of trading, is -19% when compared with the broader tech sector.
How to Make Money from Tech IPOs
So does that mean that investors should avoid tech IPOs? Not necessarily.
Longer-term analysis from the University of Florida’s Warrington College of Business shows that U.S. tech IPOs offer better returns than other sectors as long as investors get in at the offer price.
U.S. Tech IPO Returns from Offer Price
| Sector | Avg. Three-Year Return | Market-adjusted Return |
|---|---|---|
| Tech | 77.0% | 28.3% |
| Non-Tech | 34.6% | -11.4% |
Even when adjusting for the broader market performance, tech IPOs have been solid in comparison to the offer price.
The challenge is that if investors are buying stock after that first day market bump, they may have already missed out on meaningful gains:
U.S. Tech IPO Returns from First Closing Price
| Sector | Avg. Three-Year Return | Market-adjusted Return |
|---|---|---|
| Tech | 46.1% | -2.7% |
| Non-Tech | 23.7% | -22.2% |
So should investors shy away from tech IPOs unless they’re able to get in early?
Generally speaking, the analysis holds that new tech companies perform relatively well, but not better than the broader market once they’ve started trading.
However, in a world of billion-dollar unicorns, there are always exceptions to the rule. The University of Florida study found that tech companies with a base of over $100 million in sales before going public saw a market-adjusted three-year return of 24.4% from the first closing price.
If you can sift through the hype and properly analyze the right tech IPO to support, the reality can be rewarding.


Technology
Ranked: Semiconductor Companies by Industry Revenue Share
Nvidia is coming for Intel’s crown. Samsung is losing ground. AI is transforming the space. We break down revenue for semiconductor companies.


Semiconductor Companies by Industry Revenue Share
This was originally posted on our Voronoi app. Download the app for free on Apple or Android and discover incredible data-driven charts from a variety of trusted sources.
Did you know that some computer chips are now retailing for the price of a new BMW?
As computers invade nearly every sphere of life, so too have the chips that power them, raising the revenues of the businesses dedicated to designing them.
But how did various chipmakers measure against each other last year?
We rank the biggest semiconductor companies by their percentage share of the industry’s revenues in 2023, using data from Omdia research.
Which Chip Company Made the Most Money in 2023?
Market leader and industry-defining veteran Intel still holds the crown for the most revenue in the sector, crossing $50 billion in 2023, or 10% of the broader industry’s topline.
All is not well at Intel, however, with the company’s stock price down over 20% year-to-date after it revealed billion-dollar losses in its foundry business.
| Rank | Company | 2023 Revenue | % of Industry Revenue |
|---|---|---|---|
| 1 | Intel | $51B | 9.4% |
| 2 | NVIDIA | $49B | 9.0% |
| 3 | Samsung Electronics | $44B | 8.1% |
| 4 | Qualcomm | $31B | 5.7% |
| 5 | Broadcom | $28B | 5.2% |
| 6 | SK Hynix | $24B | 4.4% |
| 7 | AMD | $22B | 4.1% |
| 8 | Apple | $19B | 3.4% |
| 9 | Infineon Tech | $17B | 3.2% |
| 10 | STMicroelectronics | $17B | 3.2% |
| 11 | Texas Instruments | $17B | 3.1% |
| 12 | Micron Technology | $16B | 2.9% |
| 13 | MediaTek | $14B | 2.6% |
| 14 | NXP | $13B | 2.4% |
| 15 | Analog Devices | $12B | 2.2% |
| 16 | Renesas Electronics Corporation | $11B | 1.9% |
| 17 | Sony Semiconductor Solutions Corporation | $10B | 1.9% |
| 18 | Microchip Technology | $8B | 1.5% |
| 19 | Onsemi | $8B | 1.4% |
| 20 | KIOXIA Corporation | $7B | 1.3% |
| N/A | Others | $126B | 23.2% |
| N/A | Total | $545B | 100% |
Note: Figures are rounded. Totals and percentages may not sum to 100.
Meanwhile, Nvidia is very close to overtaking Intel, after declaring $49 billion of topline revenue for 2023. This is more than double its 2022 revenue ($21 billion), increasing its share of industry revenues to 9%.
Nvidia’s meteoric rise has gotten a huge thumbs-up from investors. It became a trillion dollar stock last year, and broke the single-day gain record for market capitalization this year.
Other chipmakers haven’t been as successful. Out of the top 20 semiconductor companies by revenue, 12 did not match their 2022 revenues, including big names like Intel, Samsung, and AMD.
The Many Different Types of Chipmakers
All of these companies may belong to the same industry, but they don’t focus on the same niche.
According to Investopedia, there are four major types of chips, depending on their functionality: microprocessors, memory chips, standard chips, and complex systems on a chip.
Nvidia’s core business was once GPUs for computers (graphics processing units), but in recent years this has drastically shifted towards microprocessors for analytics and AI.
These specialized chips seem to be where the majority of growth is occurring within the sector. For example, companies that are largely in the memory segment—Samsung, SK Hynix, and Micron Technology—saw peak revenues in the mid-2010s.

-

 Markets2 weeks ago
America’s Top Companies by Revenue (1994 vs. 2023)
-

 Environment1 week ago
Ranked: Top Countries by Total Forest Loss Since 2001
-

 Real Estate2 weeks ago
Visualizing America’s Shortage of Affordable Homes
-

 Maps2 weeks ago
Mapped: Average Wages Across Europe
-

 Mining2 weeks ago
Charted: The Value Gap Between the Gold Price and Gold Miners
-

 Demographics2 weeks ago
Visualizing the Size of the Global Senior Population
-

 Automotive2 weeks ago
Tesla Is Once Again the World’s Best-Selling EV Company
-

 Technology2 weeks ago
Ranked: The Most Popular Smartphone Brands in the U.S.