Technology
Animation: Human Population Growth Over All of History
Imagine that for every million people on Earth, there was a single dot on a map.
In total, that would be about 7,600 dots – representing today’s global population of 7.6 billion.
But, what if we went back in time, and watched those dots accumulate over human history? When and where do the first dots appear, and when does population growth ramp up to get to the billions of people that are alive today?
The History of Population Growth
Today’s animation comes from the American Museum of Natural History, and it shows over 200,000 years of population growth and the major events along the way.
If you consider yourself on the more impatient side of things, we suggest starting at 1:50 which will zoom you to 400 AD – the time of India’s Golden Age. Alternatively, go to 3:25 to witness the Bubonic Plague’s rare negative impact on population growth, as well as the ensuing age of European exploration.
It took 200,000 years of human history to get to one billion people – and just 200 years to reach seven billion.
That’s partly how the exponential “hockey stick” growth curve works, but it is also a factor of improvements in living standards, sanitation, and medicine that came after the Industrial Revolution.
Key Population Moments
Here are a few moments that stood out to us in the video, that we think represent particularly interesting moments in human population history:
Agriculture
The impact of farming cannot be emphasized enough. For many thousands of years, the human population dwindled until we learned how to plant crops to provide a scalable and sustainable food supply for a hungry population.
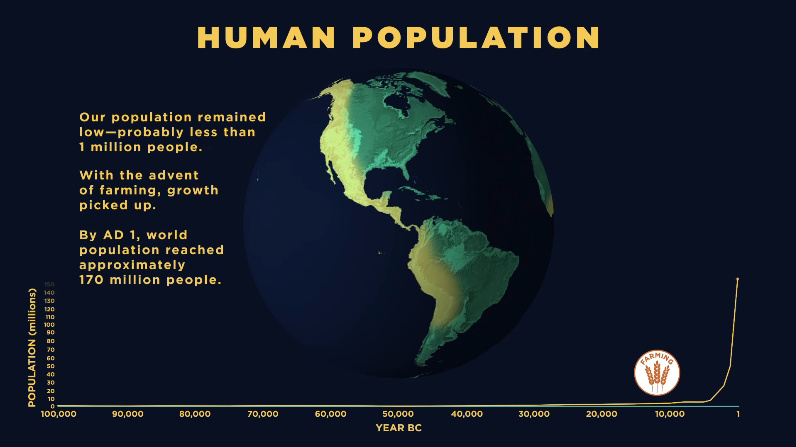
As you can see, after agriculture starts spreading, the human population quickly skyrockets. It is estimated to have reached roughly 170 million by the year 1 AD.
East vs. West
The Greeks and Romans were interesting cultures to us in many ways – but one thing that is sometimes missed with a Western education is the sheer size of Indian and Chinese civilizations.
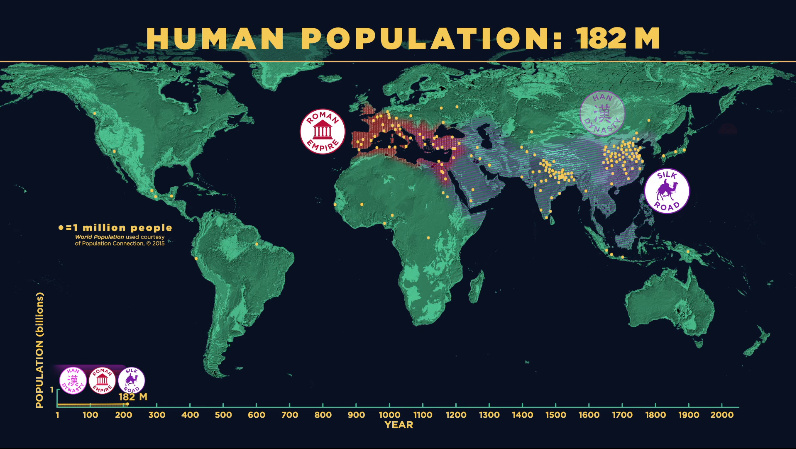
The above screenshot is from close to the territorial peak of the Roman Empire – notice its size in comparison to the Han Dynasty in China, as well as the area that is modern-day India.
Bubonic Plague
The Black Death, which started in 1347, didn’t do much to increase Europe’s population.
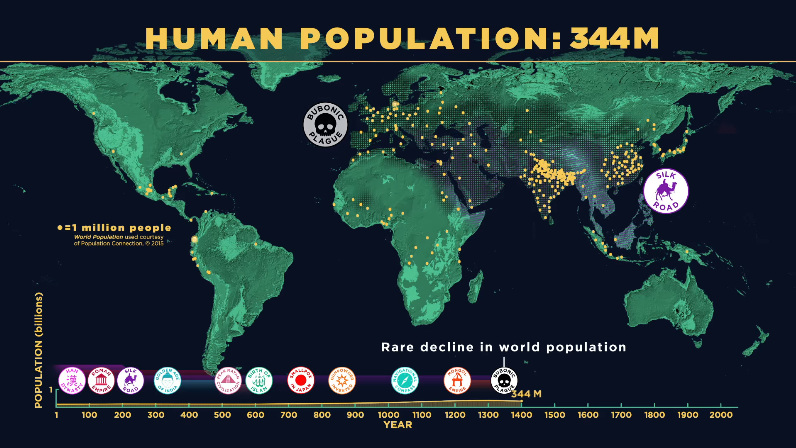
In fact, this was one of the rare times that global human population growth went backwards for multiple decades.
Post-Industrial Revolution
The Industrial Revolution brought innovations to food and medicine, and kickstarted an era that would be usher in the birth of many new technologies.
This screenshot is from close to 1900, when these innovations started to make rapid global population growth a reality.
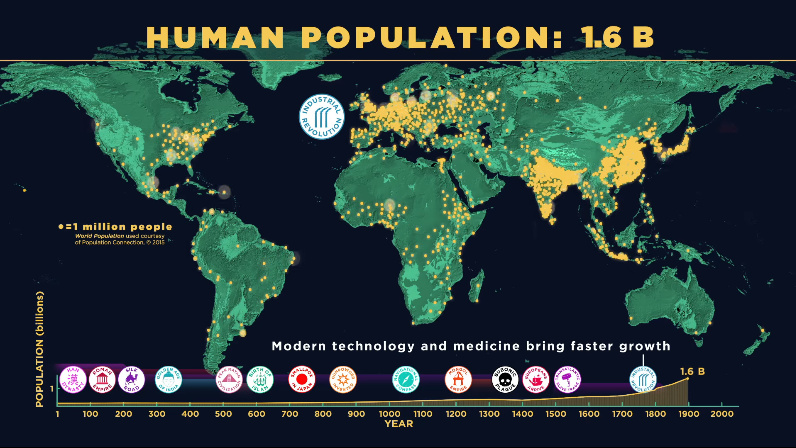
Over the next century, the population would more than quadruple to today’s seven billion plus people.
The Future of Population Growth
Naturally, this leads to thinking about the future of the human population.
For that, we recommend visiting these two prior animations: The 20 Most Populous Megacities in 2100 and The World’s Population by Region in 2100.


Technology
Visualizing AI Patents by Country
See which countries have been granted the most AI patents each year, from 2012 to 2022.


Visualizing AI Patents by Country
This was originally posted on our Voronoi app. Download the app for free on iOS or Android and discover incredible data-driven charts from a variety of trusted sources.
This infographic shows the number of AI-related patents granted each year from 2010 to 2022 (latest data available). These figures come from the Center for Security and Emerging Technology (CSET), accessed via Stanford University’s 2024 AI Index Report.
From this data, we can see that China first overtook the U.S. in 2013. Since then, the country has seen enormous growth in the number of AI patents granted each year.
| Year | China | EU and UK | U.S. | RoW | Global Total |
|---|---|---|---|---|---|
| 2010 | 307 | 137 | 984 | 571 | 1,999 |
| 2011 | 516 | 129 | 980 | 581 | 2,206 |
| 2012 | 926 | 112 | 950 | 660 | 2,648 |
| 2013 | 1,035 | 91 | 970 | 627 | 2,723 |
| 2014 | 1,278 | 97 | 1,078 | 667 | 3,120 |
| 2015 | 1,721 | 110 | 1,135 | 539 | 3,505 |
| 2016 | 1,621 | 128 | 1,298 | 714 | 3,761 |
| 2017 | 2,428 | 144 | 1,489 | 1,075 | 5,136 |
| 2018 | 4,741 | 155 | 1,674 | 1,574 | 8,144 |
| 2019 | 9,530 | 322 | 3,211 | 2,720 | 15,783 |
| 2020 | 13,071 | 406 | 5,441 | 4,455 | 23,373 |
| 2021 | 21,907 | 623 | 8,219 | 7,519 | 38,268 |
| 2022 | 35,315 | 1,173 | 12,077 | 13,699 | 62,264 |
In 2022, China was granted more patents than every other country combined.
While this suggests that the country is very active in researching the field of artificial intelligence, it doesn’t necessarily mean that China is the farthest in terms of capability.
Key Facts About AI Patents
According to CSET, AI patents relate to mathematical relationships and algorithms, which are considered abstract ideas under patent law. They can also have different meaning, depending on where they are filed.
In the U.S., AI patenting is concentrated amongst large companies including IBM, Microsoft, and Google. On the other hand, AI patenting in China is more distributed across government organizations, universities, and tech firms (e.g. Tencent).
In terms of focus area, China’s patents are typically related to computer vision, a field of AI that enables computers and systems to interpret visual data and inputs. Meanwhile America’s efforts are more evenly distributed across research fields.
Learn More About AI From Visual Capitalist
If you want to see more data visualizations on artificial intelligence, check out this graphic that shows which job departments will be impacted by AI the most.

-

 Markets1 week ago
U.S. Debt Interest Payments Reach $1 Trillion
-

 Business2 weeks ago
Charted: Big Four Market Share by S&P 500 Audits
-

 Real Estate2 weeks ago
Ranked: The Most Valuable Housing Markets in America
-

 Money2 weeks ago
Which States Have the Highest Minimum Wage in America?
-

 AI2 weeks ago
Ranked: Semiconductor Companies by Industry Revenue Share
-

 Markets2 weeks ago
Ranked: The World’s Top Flight Routes, by Revenue
-

 Demographics2 weeks ago
Population Projections: The World’s 6 Largest Countries in 2075
-

 Markets2 weeks ago
The Top 10 States by Real GDP Growth in 2023