Money
How Different Age Groups View the Trade-Off Between Time and Money
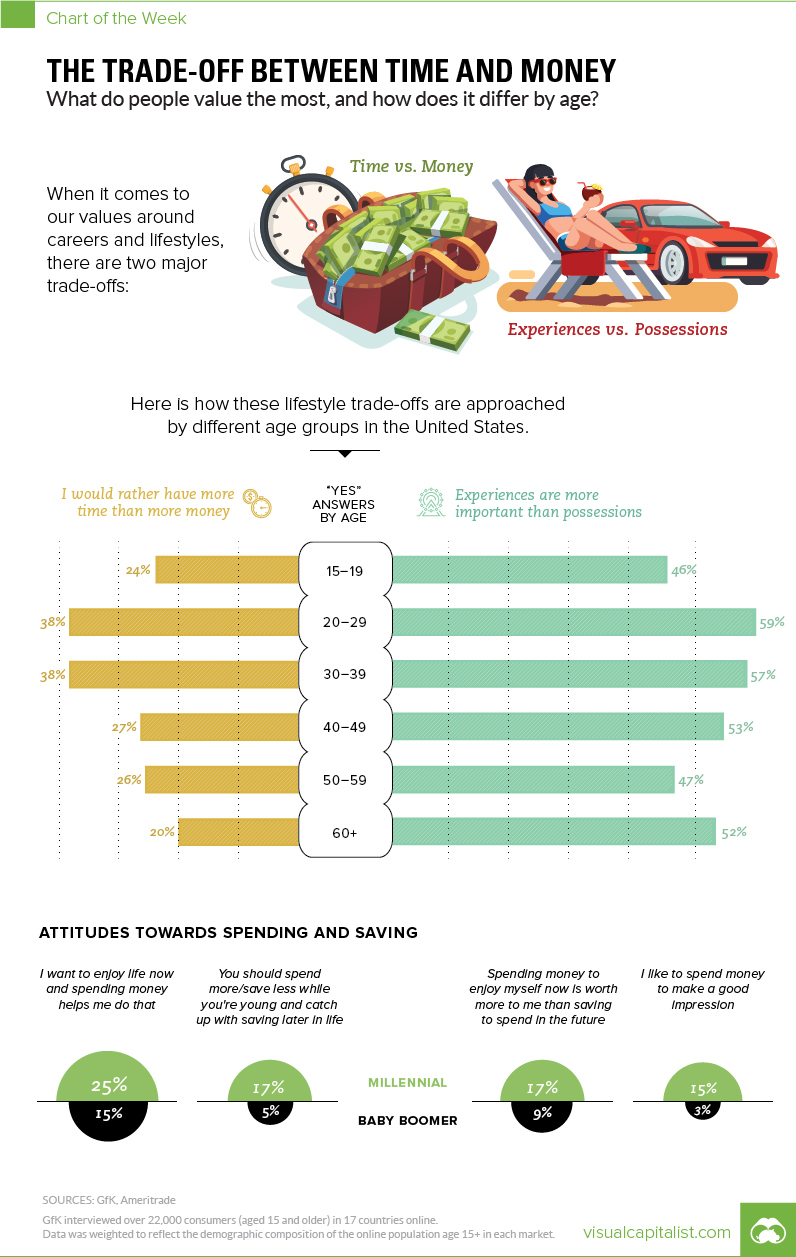
The Trade-Off Between Time and Money
The Chart of the Week is a weekly Visual Capitalist feature on Fridays.
Every individual person has their own unique set of values when it comes to how they approach their lifestyle and career.
Generally speaking, however, most people have a viewpoint on the inherent trade-off between time and money, as well as whether these precious resources should be used to seek out experiences or buy possessions.
Today’s chart uses data from a global survey of 22,000 internet users in 17 different countries by GfK Global, which gave people the option to choose whether they valued:
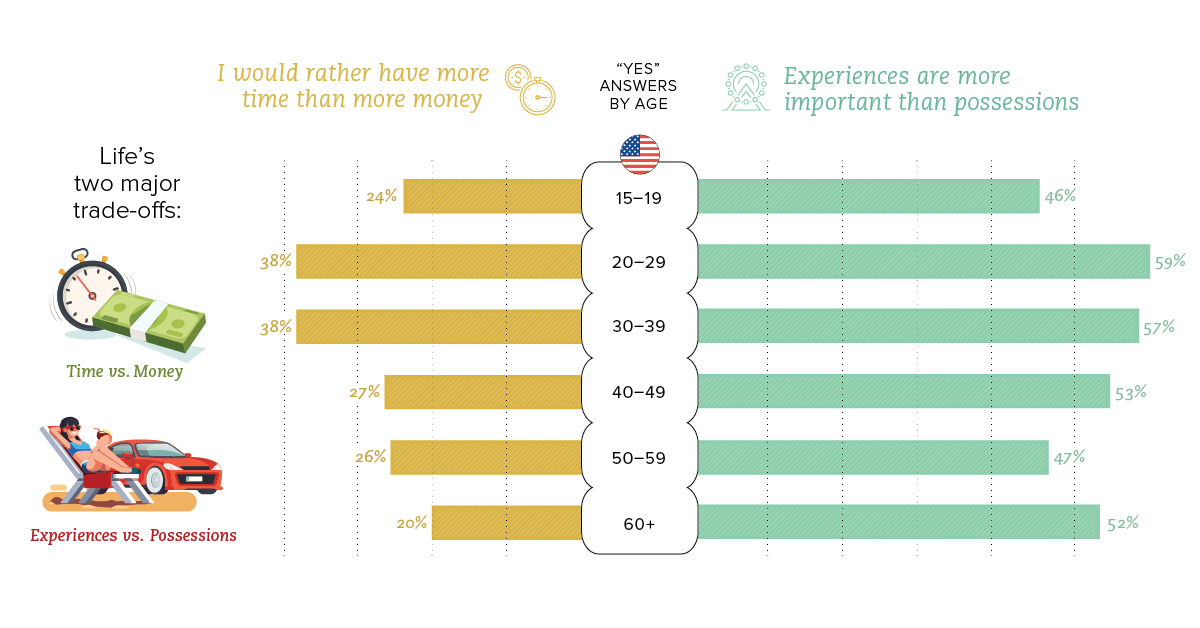
- Time vs. Money
- Experiences vs. Possessions
We’ll first look at the U.S. data with a focus on generational differences, and then we’ll present the international data on how this trade-off between time and money manifests itself between countries.
Generational Differences
Judging by age alone, one might guess that younger generations would prefer to “take the money and run”. After all, millennials are often stereotyped as a cash-strapped generation.
Interestingly, this doesn’t seem to be the case at all, at least according to U.S. data:
| Age Group | Time > Money (% agree) | Experiences > Possessions (% agree) |
|---|---|---|
| 15-19 years | 24% | 46% |
| 20-29 years | 38% | 59% |
| 30-39 years | 38% | 57% |
| 40-49 years | 27% | 53% |
| 50-59 years | 26% | 47% |
| 60+ years | 20% | 52% |
When it comes to time and money, 38% of both the 20-29 year and 30-39 year ranges prefer to choose time over money. This is a significantly higher portion than those of other age groups. Surprisingly, only 20% of people in the 60+ group clearly had a preference for time over money.
As for experiences and possessions, it was a similar case, with the 20-29 year and 30-39 year groups having the highest preference for experiences. This is not surprising, and it’s a widely known millennial attribute to seek powerful experiences like travel, music festivals, sports, and live events over buying new material possessions such as furniture or a new car.
International Differences
How do people from different countries approach the same survey questions?
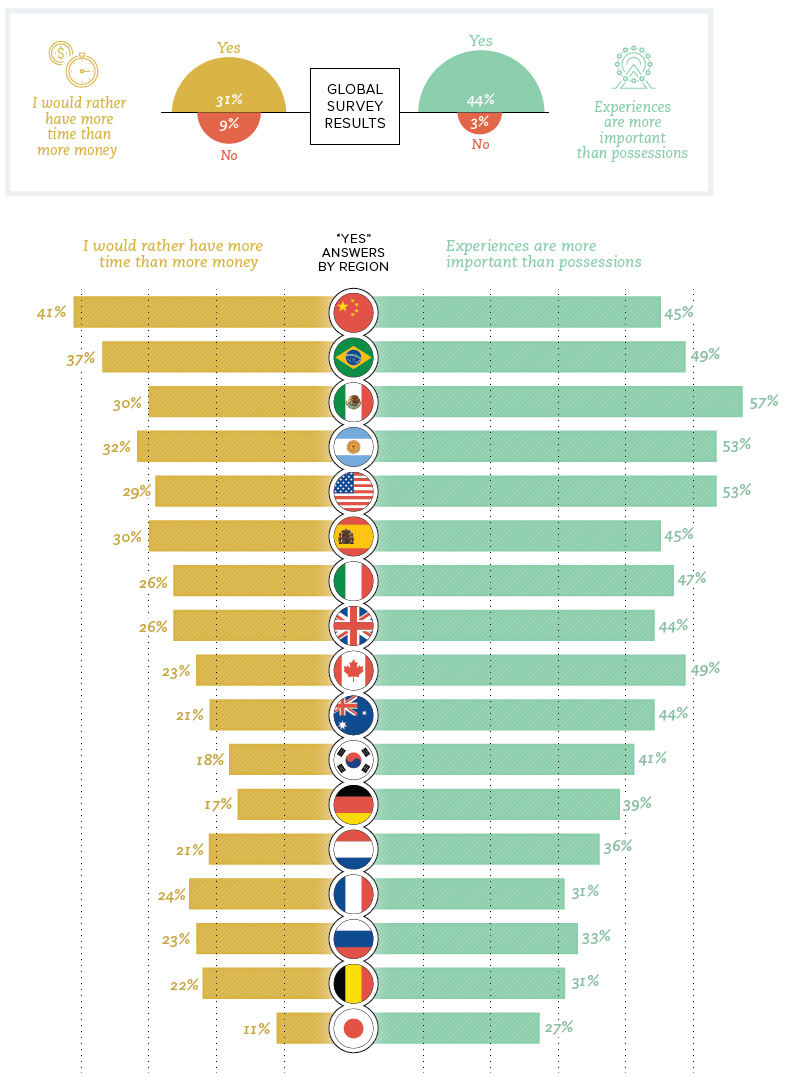
The international chart reveals some interesting differences about the perceived value of time and money.
One very stark one lies between two Asian nations in close proximity. Folks surveyed from China had the highest preference for time over money (41% agreeing), while across the East China Sea, in Japan, the results show the lowest preference for time over money (11% agreeing).
Another interesting cultural difference: countries in Latin America tend to see experiences as far more important than the rest of the globe. Mexico (57%), Argentina (53%), and Brazil (49%) all were well above the global average of 44% for choosing experiences over possessions.


Money
Charted: Which City Has the Most Billionaires in 2024?
Just two countries account for half of the top 20 cities with the most billionaires. And the majority of the other half are found in Asia.


Charted: Which Country Has the Most Billionaires in 2024?
This was originally posted on our Voronoi app. Download the app for free on iOS or Android and discover incredible data-driven charts from a variety of trusted sources.
Some cities seem to attract the rich. Take New York City for example, which has 340,000 high-net-worth residents with investable assets of more than $1 million.
But there’s a vast difference between being a millionaire and a billionaire. So where do the richest of them all live?
Using data from the Hurun Global Rich List 2024, we rank the top 20 cities with the highest number of billionaires in 2024.
A caveat to these rich lists: sources often vary on figures and exact rankings. For example, in last year’s reports, Forbes had New York as the city with the most billionaires, while the Hurun Global Rich List placed Beijing at the top spot.
Ranked: Top 20 Cities with the Most Billionaires in 2024
The Chinese economy’s doldrums over the course of the past year have affected its ultra-wealthy residents in key cities.
Beijing, the city with the most billionaires in 2023, has not only ceded its spot to New York, but has dropped to #4, overtaken by London and Mumbai.
| Rank | City | Billionaires | Rank Change YoY |
|---|---|---|---|
| 1 | 🇺🇸 New York | 119 | +1 |
| 2 | 🇬🇧 London | 97 | +3 |
| 3 | 🇮🇳 Mumbai | 92 | +4 |
| 4 | 🇨🇳 Beijing | 91 | -3 |
| 5 | 🇨🇳 Shanghai | 87 | -2 |
| 6 | 🇨🇳 Shenzhen | 84 | -2 |
| 7 | 🇭🇰 Hong Kong | 65 | -1 |
| 8 | 🇷🇺 Moscow | 59 | No Change |
| 9 | 🇮🇳 New Delhi | 57 | +6 |
| 10 | 🇺🇸 San Francisco | 52 | No Change |
| 11 | 🇹🇭 Bangkok | 49 | +2 |
| 12 | 🇹🇼 Taipei | 45 | +2 |
| 13 | 🇫🇷 Paris | 44 | -2 |
| 14 | 🇨🇳 Hangzhou | 43 | -5 |
| 15 | 🇸🇬 Singapore | 42 | New to Top 20 |
| 16 | 🇨🇳 Guangzhou | 39 | -4 |
| 17T | 🇮🇩 Jakarta | 37 | +1 |
| 17T | 🇧🇷 Sao Paulo | 37 | No Change |
| 19T | 🇺🇸 Los Angeles | 31 | No Change |
| 19T | 🇰🇷 Seoul | 31 | -3 |
In fact all Chinese cities on the top 20 list have lost billionaires between 2023–24. Consequently, they’ve all lost ranking spots as well, with Hangzhou seeing the biggest slide (-5) in the top 20.
Where China lost, all other Asian cities—except Seoul—in the top 20 have gained ranks. Indian cities lead the way, with New Delhi (+6) and Mumbai (+3) having climbed the most.
At a country level, China and the U.S combine to make up half of the cities in the top 20. They are also home to about half of the world’s 3,200 billionaire population.
In other news of note: Hurun officially counts Taylor Swift as a billionaire, estimating her net worth at $1.2 billion.

-

 Mining1 week ago
Gold vs. S&P 500: Which Has Grown More Over Five Years?
-

 Markets2 weeks ago
Ranked: The Most Valuable Housing Markets in America
-

 Money2 weeks ago
Which States Have the Highest Minimum Wage in America?
-

 AI2 weeks ago
Ranked: Semiconductor Companies by Industry Revenue Share
-

 Markets2 weeks ago
Ranked: The World’s Top Flight Routes, by Revenue
-

 Countries2 weeks ago
Population Projections: The World’s 6 Largest Countries in 2075
-

 Markets2 weeks ago
The Top 10 States by Real GDP Growth in 2023
-

 Demographics2 weeks ago
The Smallest Gender Wage Gaps in OECD Countries