Markets
The $80 Trillion World Economy in One Chart
Check out the latest 2023 update of the world economy in one chart.
The $80 Trillion World Economy in One Chart
Check out the latest 2023 update of the world economy in one chart.
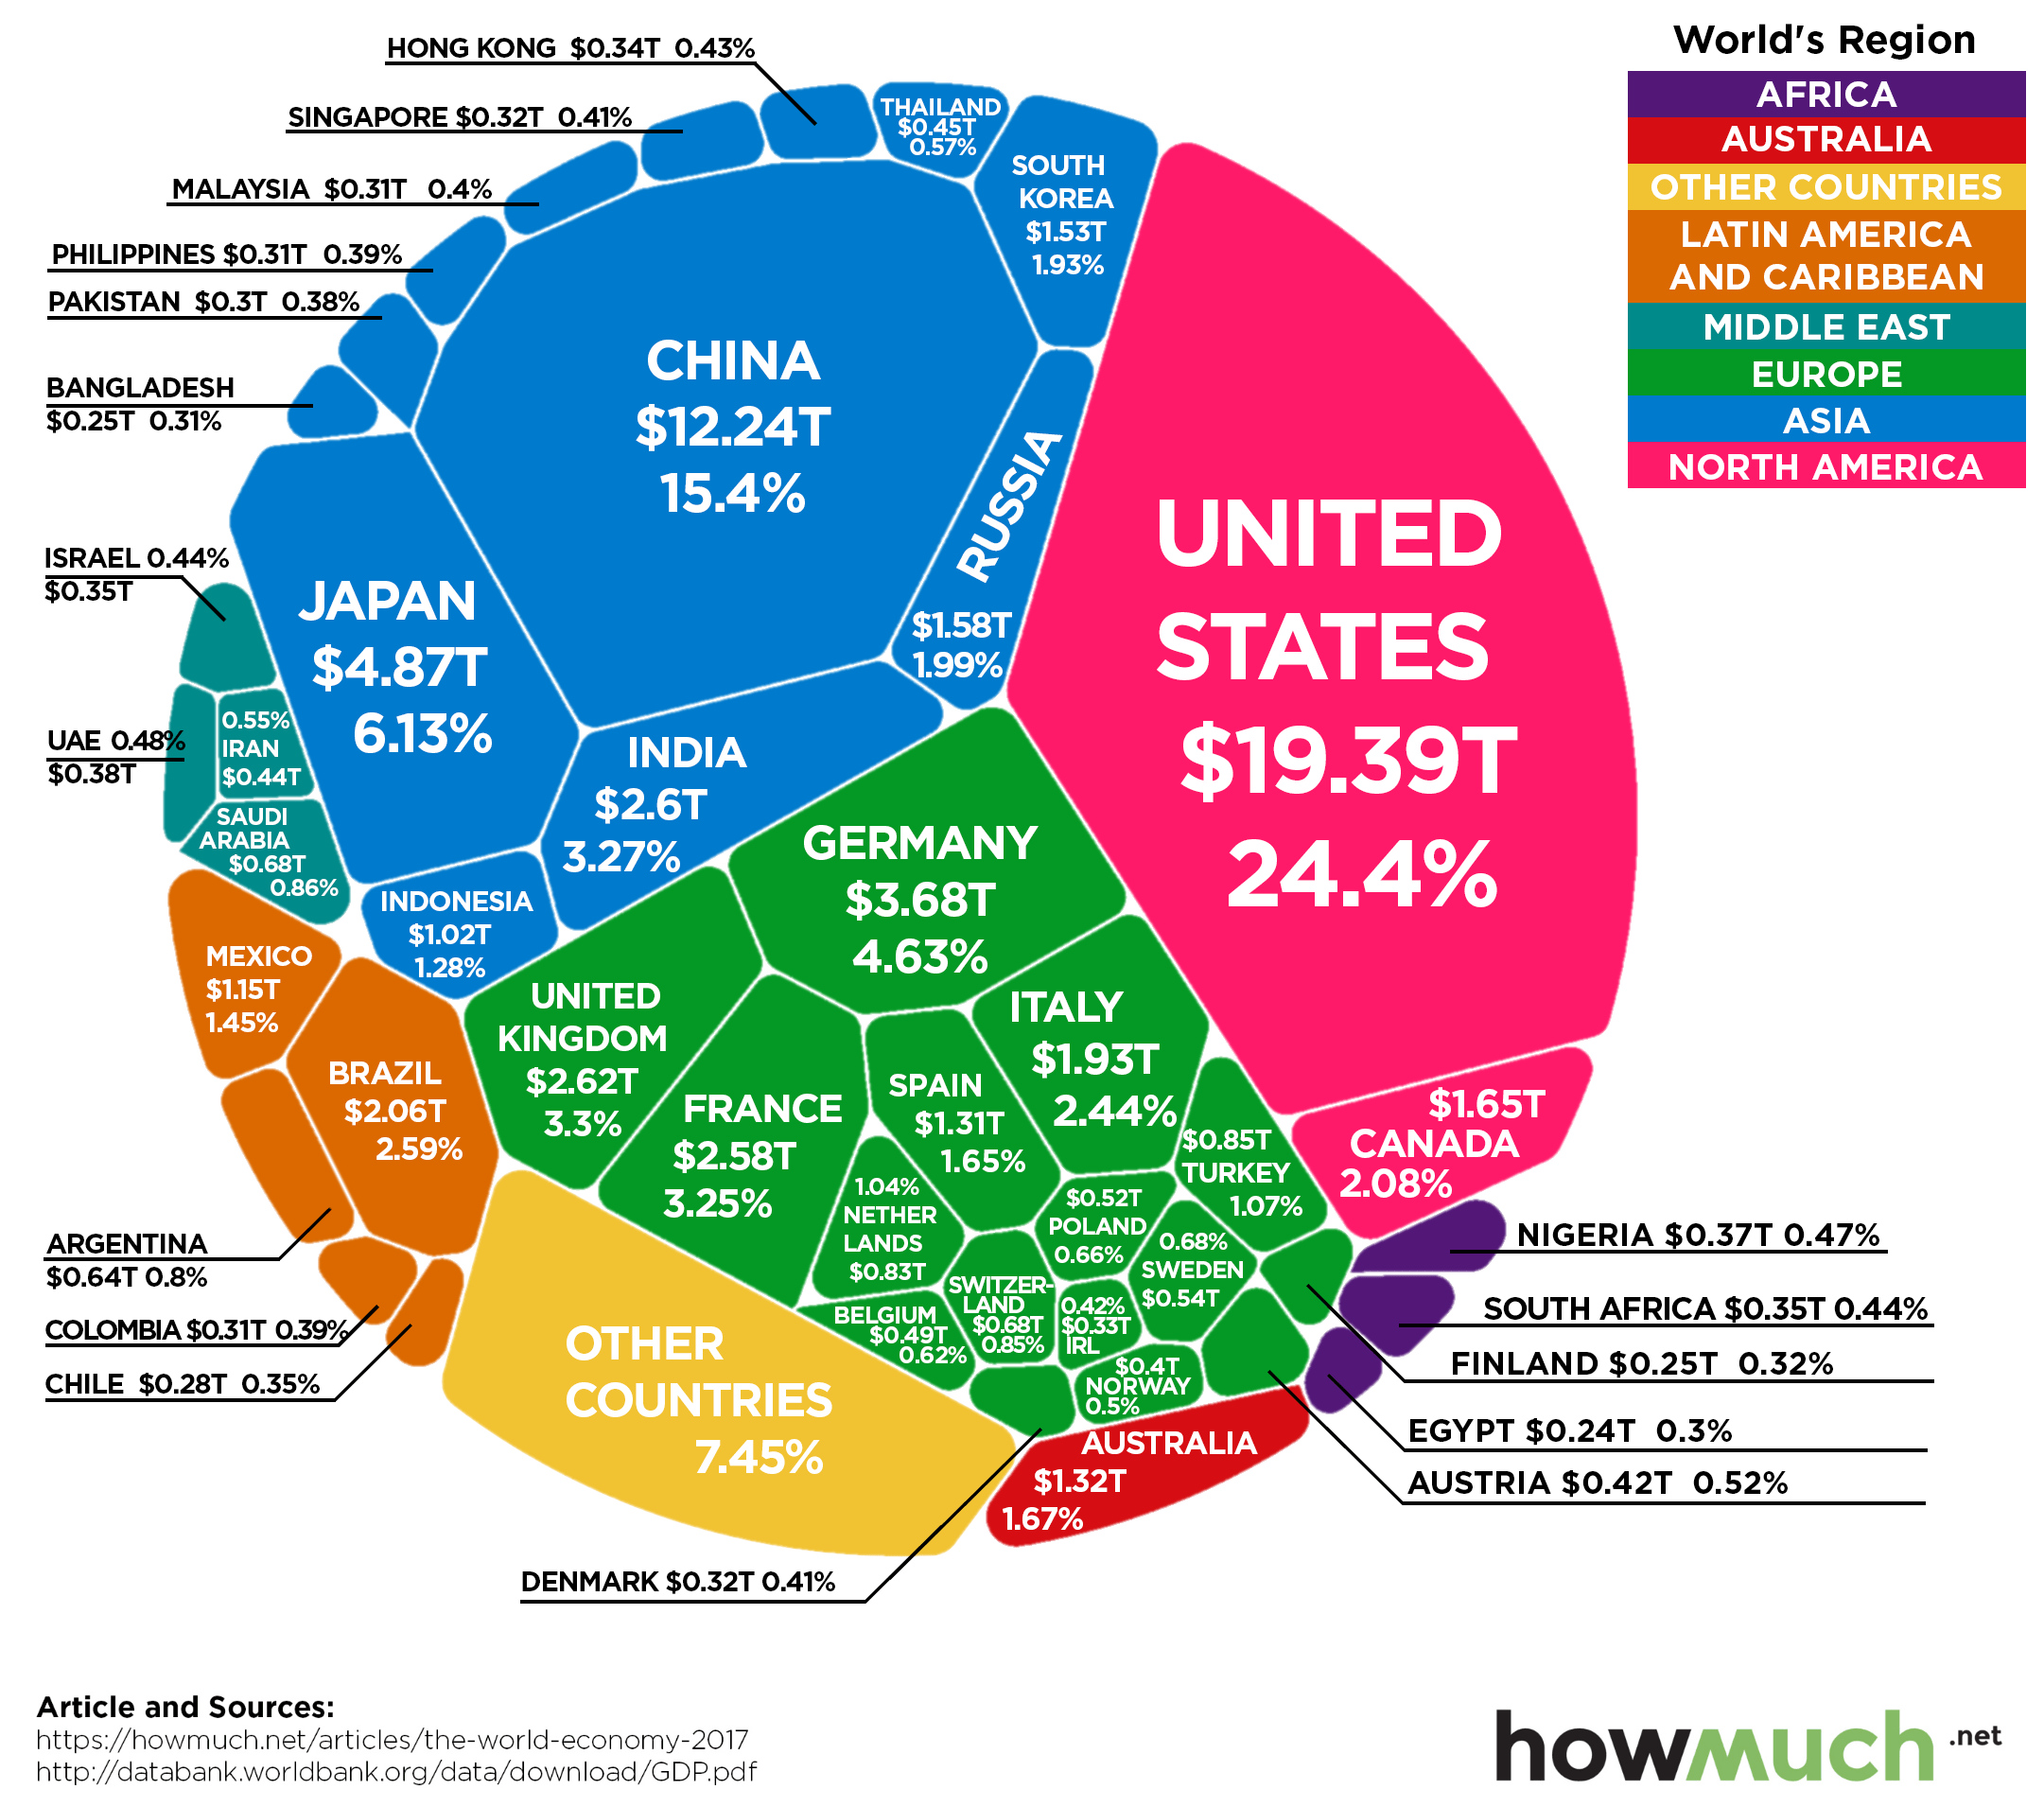
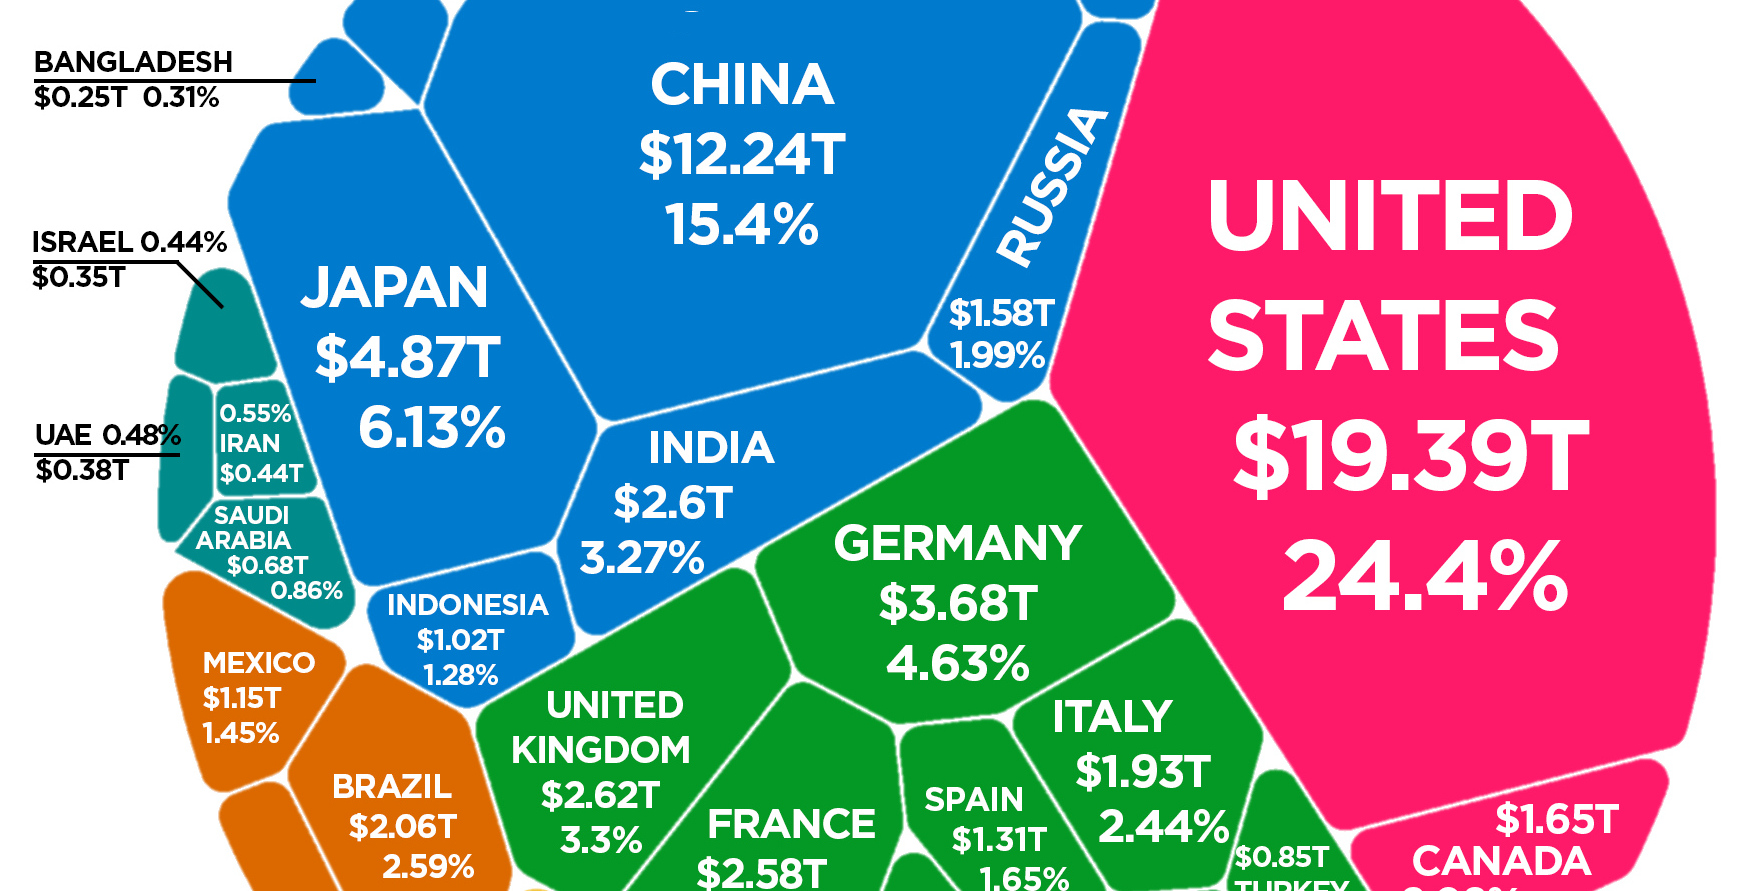
The latest estimate from the World Bank puts global GDP at roughly $80 trillion in nominal terms for 2017.
Today’s chart from HowMuch.net uses this data to show all major economies in a visualization called a Voronoi diagram – let’s dive into the stats to learn more.
The World’s Top 10 Economies
Here are the world’s top 10 economies, which together combine for a whopping two-thirds of global GDP.
| Rank | Country | GDP | % of Global GDP |
|---|---|---|---|
| #1 | United States | $19.4 trillion | 24.4% |
| #2 | China | $12.2 trillion | 15.4% |
| #3 | Japan | $4.87 trillion | 6.1% |
| #4 | Germany | $3.68 trillion | 4.6% |
| #5 | United Kingdom | $2.62 trillion | 3.3% |
| #6 | India | $2.60 trillion | 3.3% |
| #7 | France | $2.58 trillion | 3.3% |
| #8 | Brazil | $2.06 trillion | 2.6% |
| #9 | Italy | $1.93 trillion | 2.4% |
| #10 | Canada | $1.65 trillion | 2.1% |
In nominal terms, the U.S. still has the largest GDP at $19.4 trillion, making up 24.4% of the world economy.
While China’s economy is far behind in nominal terms at $12.2 trillion, you may recall that the Chinese economy has been the world’s largest when adjusted for purchasing power parity (PPP) since 2016.
The next two largest economies are Japan ($4.9 trillion) and Germany ($4.6 trillion) – and when added to the U.S. and China, the top four economies combined account for over 50% of the world economy.
Movers and Shakers
Over recent years, the list of top economies hasn’t changed much – and in a similar visualization we posted 18 months ago, the four aforementioned top economies all fell in the exact same order.
However, look outside of these incumbents, and you’ll see that the major forces shaping the future of the global economy are in full swing, especially when it comes to emerging markets.
Here are some of the most important movements:
India has now passed France in nominal terms with a $2.6 trillion economy, which is about 3.3% of the global total. In the most recent quarter, Indian GDP growth saw its highest growth rate in two years at about 8.2%.
Brazil, despite its very recent economic woes, surpassed Italy in GDP rankings to take the #8 spot overall.
Turkey has surpassed The Netherlands to become the world’s 17th largest economy, and Saudi Arabia has jumped past Switzerland to claim the 19th spot.


Economy
Economic Growth Forecasts for G7 and BRICS Countries in 2024
The IMF has released its economic growth forecasts for 2024. How do the G7 and BRICS countries compare?


G7 & BRICS Real GDP Growth Forecasts for 2024
The International Monetary Fund’s (IMF) has released its real gross domestic product (GDP) growth forecasts for 2024, and while global growth is projected to stay steady at 3.2%, various major nations are seeing declining forecasts.
This chart visualizes the 2024 real GDP growth forecasts using data from the IMF’s 2024 World Economic Outlook for G7 and BRICS member nations along with Saudi Arabia, which is still considering an invitation to join the bloc.
Get the Key Insights of the IMF’s World Economic Outlook
Want a visual breakdown of the insights from the IMF’s 2024 World Economic Outlook report?
This visual is part of a special dispatch of the key takeaways exclusively for VC+ members.
Get the full dispatch of charts by signing up to VC+.
Mixed Economic Growth Prospects for Major Nations in 2024
Economic growth projections by the IMF for major nations are mixed, with the majority of G7 and BRICS countries forecasted to have slower growth in 2024 compared to 2023.
Only three BRICS-invited or member countries, Saudi Arabia, the UAE, and South Africa, have higher projected real GDP growth rates in 2024 than last year.
| Group | Country | Real GDP Growth (2023) | Real GDP Growth (2024P) |
|---|---|---|---|
| G7 | 🇺🇸 U.S. | 2.5% | 2.7% |
| G7 | 🇨🇦 Canada | 1.1% | 1.2% |
| G7 | 🇯🇵 Japan | 1.9% | 0.9% |
| G7 | 🇫🇷 France | 0.9% | 0.7% |
| G7 | 🇮🇹 Italy | 0.9% | 0.7% |
| G7 | 🇬🇧 UK | 0.1% | 0.5% |
| G7 | 🇩🇪 Germany | -0.3% | 0.2% |
| BRICS | 🇮🇳 India | 7.8% | 6.8% |
| BRICS | 🇨🇳 China | 5.2% | 4.6% |
| BRICS | 🇦🇪 UAE | 3.4% | 3.5% |
| BRICS | 🇮🇷 Iran | 4.7% | 3.3% |
| BRICS | 🇷🇺 Russia | 3.6% | 3.2% |
| BRICS | 🇪🇬 Egypt | 3.8% | 3.0% |
| BRICS-invited | 🇸🇦 Saudi Arabia | -0.8% | 2.6% |
| BRICS | 🇧🇷 Brazil | 2.9% | 2.2% |
| BRICS | 🇿🇦 South Africa | 0.6% | 0.9% |
| BRICS | 🇪🇹 Ethiopia | 7.2% | 6.2% |
| 🌍 World | 3.2% | 3.2% |
China and India are forecasted to maintain relatively high growth rates in 2024 at 4.6% and 6.8% respectively, but compared to the previous year, China is growing 0.6 percentage points slower while India is an entire percentage point slower.
On the other hand, four G7 nations are set to grow faster than last year, which includes Germany making its comeback from its negative real GDP growth of -0.3% in 2023.
Faster Growth for BRICS than G7 Nations
Despite mostly lower growth forecasts in 2024 compared to 2023, BRICS nations still have a significantly higher average growth forecast at 3.6% compared to the G7 average of 1%.
While the G7 countries’ combined GDP is around $15 trillion greater than the BRICS nations, with continued higher growth rates and the potential to add more members, BRICS looks likely to overtake the G7 in economic size within two decades.
BRICS Expansion Stutters Before October 2024 Summit
BRICS’ recent expansion has stuttered slightly, as Argentina’s newly-elected president Javier Milei declined its invitation and Saudi Arabia clarified that the country is still considering its invitation and has not joined BRICS yet.
Even with these initial growing pains, South Africa’s Foreign Minister Naledi Pandor told reporters in February that 34 different countries have submitted applications to join the growing BRICS bloc.
Any changes to the group are likely to be announced leading up to or at the 2024 BRICS summit which takes place October 22-24 in Kazan, Russia.
Get the Full Analysis of the IMF’s Outlook on VC+
This visual is part of an exclusive special dispatch for VC+ members which breaks down the key takeaways from the IMF’s 2024 World Economic Outlook.
For the full set of charts and analysis, sign up for VC+.

-

 Markets1 week ago
U.S. Debt Interest Payments Reach $1 Trillion
-

 Business2 weeks ago
Charted: Big Four Market Share by S&P 500 Audits
-

 Real Estate2 weeks ago
Ranked: The Most Valuable Housing Markets in America
-

 Money2 weeks ago
Which States Have the Highest Minimum Wage in America?
-

 AI2 weeks ago
Ranked: Semiconductor Companies by Industry Revenue Share
-

 Markets2 weeks ago
Ranked: The World’s Top Flight Routes, by Revenue
-

 Demographics2 weeks ago
Population Projections: The World’s 6 Largest Countries in 2075
-

 Markets2 weeks ago
The Top 10 States by Real GDP Growth in 2023